2. Beginner Path
This is documentation for all non-pros that goes into greater detail and explains underlying concepts.
- Installation
- Foundations
- 3: Setting Up Your Foundation
- 4: Traefik - Reverse Proxy (essential)
- 5 Apprise - Notifications (optional, but essential for backups with Borgmatic)
- 6: Borgmatic - Backup System (optional, but you should have backup)
- 7: Portainer – Docker Management Made Easy (optional but convenient)
- Apps
- 8: Vaultwarden - Password Manager
- 9: Passbolt - Team Password Manager
- 10: Syncthing - File Synchronization
- 11: Nextcloud - Private Cloud
- 12: WordPress - Build Your Website
- 13: Matomo - Privacy‑Friendly Analytics
- 14: Webmin - Visual Server Management
- 15: BookStack - Documentation Platform / Wiki
- 16: Uptime Kuma - Uptime Monitoring & Status Pages
- 17: Netdata - Real-time Performance Monitoring
- 18: Netdata Director - Multi-Server Monitoring Hub
- 19: Installing WireGuard - Secure VPN Access
- 20: Warpgate - Secure SSH Gateway
- Other Features of Infinity Tools
Installation
This chapter is about getting started, installing Infinity Tools and learning about subdomains.
1: Getting Started
Welcome! This guide is designed for people who have some IT interest but don't work professionally in IT. Whether you're exploring Infinity Tools for personal use or considering it for a small business, this guide will walk you through everything step-by-step in plain language.
What Do I Need to Use Infinity Tools?
To use Infinity Tools, you need a Linux server - that's a computer running Linux that's always connected to the internet. Most people don't have a server at home, so you'll rent one from a cloud provider (like renting a computer in the cloud).
You'll Need:
- ✅ A Linux Server - We'll help you get one from a cloud provider
- ✅ A Credit Card - To pay for the server (usually $5-10/month)
- ✅ Basic Computer Skills - If you can use email and browse the web, you're good!
- ✅ About 30 Minutes - To get everything set up
Don't worry if terms like "Linux" or "server" sound scary - we'll explain everything as we go!
What is a Linux Server?
Think of a server like a computer that runs 24/7 on the internet. Instead of having a screen and keyboard, you control it remotely using your regular computer. The server runs special software (Linux) that's designed to host websites and applications.
Why rent a server?
- It's always on (your home computer isn't)
- It's fast and reliable
- It's cost-effective (much cheaper than buying hardware)
- You can access it from anywhere
Choosing a Cloud Provider
Cloud providers are companies that rent out servers. We'll focus on two beginner-friendly options that are affordable and easy to use.
Option 1: Hetzner Cloud (Recommended)
Why Hetzner:
- ✅ Excellent value for money (~€4-5/month)
- ✅ Simple and straightforward interface
- ✅ Good performance
- ✅ Based in Europe (strong data protection laws)
Perfect for: Beginners who want the best price-performance ratio
What you'll get:
- A virtual server (called a "Cloud Server")
- Full control over your server
- All the tools you need
Option 2: DigitalOcean
Why DigitalOcean:
- ✅ Very beginner-friendly interface
- ✅ Excellent documentation and tutorials
- ✅ Great customer support
- ✅ $6/month starting price
Perfect for: Beginners who want lots of help and tutorials
What you'll get:
- A "Droplet" (their name for a server)
- Web-based dashboard
- Helpful community resources
Other Options
You can also use:
- Linode - Similar to DigitalOcean, good alternative
- Vultr - Competitive pricing, global locations
- AWS Lightsail- Amazon's simple option (can be more complex)
Our recommendation: Start with Hetzner if you want the best price, or DigitalOcean if you want extra hand-holding.
Getting Your First Server
Step 1: Create an Account
- Visit Hetzner Cloud or DigitalOcean
- Click "Sign Up" or "Create Account"
- Enter your email and create a password
- Verify your email address
- Add a payment method (credit card)
Don't worry: You won't be charged until you create a server, and you can stop it anytime.
Step 2: Create Your Server
For Hetzner Cloud:
- Login to your Hetzner Cloud account
- Click "New Project" (if you don't have one)
- Name it something like "My Infinity Tools"
- Click "Add Server"
- Choose Location:
- Pick a location close to you (Germany, Finland, USA, etc.)
- Choose Image:
- Select Ubuntu 22.04 or Ubuntu 24.04 (recommended)
- Don't worry about other options - Ubuntu is perfect for beginners
- Choose Server Type:
- Select CX11 (€4.51/month) - this is enough to start
- This gives you: 1 CPU, 2GB RAM, 20GB storage
- Networking:
- Leave default settings (IPv4 enabled)
- SSH Keys:
- We'll skip this for now (covered in next article)
- Name Your Server:
- Something like "infinity-tools-server"
- Click "Create & Buy Now"
After creation: You'll see your server's IP address (looks like: 123.45.67.89) - write this down!
For DigitalOcean:
- Login to your DigitalOcean account
- Click "Create" → "Droplets"
- Choose Image:
- Select Ubuntu 22.04 LTS or Ubuntu 24.04 LTS
- Choose Plan:
- Select Basic → Regular → $6/month (1GB RAM, 1 CPU)
- Or $12/month (2GB RAM) for better performance
- Choose Datacenter Region:
- Pick a location close to you
- Authentication:
- Choose "Password" for now (we'll set up SSH keys later)
- Create a strong password - save this password!
- Finalize:
- Name your droplet (e.g., "infinity-tools")
- Click "Create Droplet"
After creation: You'll see your server's IP address - write this down!
Step 3: Configure Your Server
Once your server is created, you need to do a few basic setup steps:
Enable Basic Firewall (Important!)
Your server needs basic protection. Here's how (we'll cover connecting to your server properly in the next article, but for now):
For Hetzner:
- Firewall is usually enabled by default, but you can add rules in the Hetzner Cloud console
For DigitalOcean:
- Go to "Networking" → "Firewalls"
- Create a firewall that allows:
- SSH (port 22)
- HTTP (port 80)
- HTTPS (port 443)
- Apply it to your droplet
Why this matters: A firewall protects your server from unwanted access. We'll configure this properly later.
What You'll Need Next
Before you can install Infinity Tools, you'll need:
1. A Domain Name (Optional but Recommended)
What is a domain name? It's like an address for your website (e.g., mywebsite.com).
Why you need it: Infinity Tools can automatically set up secure connections (HTTPS) if you have a domain name. Without one, you can still use it, but browsers will show security warnings.
Where to get one:
- Namecheap - Easy to use, good prices (~$10-15/year)
- Cloudflare - Very affordable (~$9/year), includes free features
- Your cloud provider - Both Hetzner and DigitalOcean sell domains
What to do:
- Buy a domain name (e.g.,
myinfinitytools.com) - Point it to your server's IP address (we'll show you how in the next article)
Don't have a domain? That's okay! You can always add one later or use your server's IP address directly.
2. Basic Information
Server IP Address: You got this when you created your server (looks like: 123.45.67.89)
Server Password (DigitalOcean): The password you created when setting up the droplet
Cloud Provider Account: Keep your login credentials handy
Understanding Server Costs
Monthly Costs:
- Server: €4-6/month (~$5-7) for basic setup
- Domain name: ~$10-15/year (one-time each year)
- Total: ~$6-8/month for your own self-hosted services!
What's Included:
- A great variety of applications (WordPress, password manager, cloud storage, etc.)
- No per-user fees
- No storage limits (within your server's capacity)
- Full control over your data
Compared to SaaS:
- Password manager: $3-5/month per user
- Cloud storage: $5-10/month per user
- Analytics: $100s/month
- Your own server: One price, unlimited everything!
Security Basics
Keep Your Server Safe:
- ✅ Always use strong passwords
- ✅ Keep your server updated
- ✅ Use a firewall (we'll set this up)
- ✅ Don't share your server passwords
- ✅ Enable automatic security updates
Infinity Tools will help with most of this automatically!
You're Ready!
You now have:
- ✅ A cloud account
- ✅ A Linux server running
- ✅ The server's IP address
- ✅ Basic understanding of what you're working with
What's Next?
The next article will cover:
- Connecting to your server using SSH (don't worry, we'll explain this!)
- Getting Infinity Tools onto your server
- Running the installer
- Setting up your first applications
Don't worry if some of this feels new! We'll walk through everything step-by-step, and Infinity Tools will handle most of the technical stuff automatically.
Quick Tips
If you get stuck:
- Both Hetzner and DigitalOcean have excellent documentation
- Take your time - there's no rush
- You can always delete and recreate your server if something goes wrong
Safety first:
Remember:
- Your server is a computer in the cloud - treat it like any important computer
- You can stop your server anytime to avoid charges
- Start small and learn as you go
Next: Connecting to Your Server and Installing Infinity Tools (Article 2)
2: Installing Infinity Tools
Welcome back! In Chapter 1, you set up your Linux server. Now we'll connect to it and install Infinity Tools. Don't worry - we'll walk through every step together!
What We'll Do in This Chapter
By the end of this chapter, you will:
- ✅ Know how to connect to your server from your computer
- ✅ Have Infinity Tools downloaded and installed on your server
- ✅ Be able to run Infinity Tools for the first time
Time needed: About 15-20 minutes
What is SSH? (Simple Explanation)
SSH stands for "Secure Shell" - but you don't need to remember that! Think of SSH as a secure tunnel that connects your computer to your server. It's like having a remote control for your server that you can use from your regular computer.
Why we need it: Since your server is "in the cloud" (not physically in front of you), we need a way to control it. SSH is that way - it's safe, secure, and the standard way to manage servers.
Don't worry! SSH might sound technical, but we'll show you exactly how to use it. It's actually quite simple once you see it in action!
Step 1: Connect to Your Server with SSH
The first thing we need to do is connect to your server. The steps are slightly different depending on whether you use Windows, Mac, or Linux. Choose your computer type below:
For Windows Users
Windows 10 and 11 have SSH built-in (it's a program called "SSH" that comes with Windows). Here's how to use it:
Option A: Using Windows Terminal or Command Prompt
- Open Command Prompt or PowerShell:
- Press the
Windowskey - Type "cmd" or "PowerShell"
- Click on "Command Prompt" or "Windows PowerShell"
- Press the
- Connect to your server:
- Type this command (replace
YOUR_IP_ADDRESSwith your actual server IP):
- Type this command (replace
ssh root@YOUR_IP_ADDRESSFor Hetzner: root stays root (Hetzner uses root by default)
For DigitalOcean: root stays root (most DigitalOcean images use root)
Example: If your server IP is 123.45.67.89, you would type:
ssh root@123.45.67.89- You'll see a security warning:
- The first time you connect, Windows will ask "Are you sure you want to continue connecting?"
- Type
yesand press Enter - This is normal and safe - it's just Windows double-checking
- Enter your password:
- For Hetzner: If you did not provide an SSH key (we did not cover that here), Hetzner sends you a one time password via email. You will have to change it immediately after your first log-in (Linux will force you to change it).
- For DigitalOcean: Enter the password you created when setting up your droplet
- Important: When you type the password, you won't see any characters appear (not even dots). This is normal for security! Just type and press Enter.
- You're connected!
- If successful, you'll see something like:
root@infinity-tools-server:~# - This means you're now controlling your server!
- If successful, you'll see something like:
Option B: Using PuTTY (Alternative for Windows)
If you prefer a graphical interface, you can use PuTTY:
- Download PuTTY: Go to putty.org and download PuTTY
- Open PuTTY: Double-click the downloaded file
- Enter your server details:
- Host Name: Your server IP address
- Port: 22 (leave as default)
- Connection Type: SSH
- Click "Open"
- Enter your username:
root - Enter your password when prompted
- You're connected!
More Resources for Windows:
For Mac Users
Mac has SSH built-in (it's in the Terminal app). Here's how to use it:
- Open Terminal:
- Press
Command + Space(Command is the ⌘ key) - Type "Terminal"
- Press Enter
- Press
- Connect to your server:
- Type this command (replace
YOUR_IP_ADDRESSwith your actual server IP):
- Type this command (replace
ssh root@YOUR_IP_ADDRESSExample: If your server IP is 123.45.67.89, you would type:
ssh root@123.45.67.89- You'll see a security warning:
- The first time you connect, Mac will ask "Are you sure you want to continue connecting?"
- Type
yesand press Enter
- Enter your password:
- For Hetzner: If you did not provide an SSH key (we did not cover that here), Hetzner sends you a one time password via email. You will have to change it immediately after your first log-in (Linux will force you to change it).
- For DigitalOcean: Enter the password you created when setting up your droplet
- Important: When you type the password, you won't see any characters appear. This is normal! Just type and press Enter.
- For Hetzner: If you did not provide an SSH key (we did not cover that here), Hetzner sends you a one time password via email. You will have to change it immediately after your first log-in (Linux will force you to change it).
- You're connected!
- If successful, you'll see something like:
root@infinity-tools-server:~# - You're now controlling your server!
- If successful, you'll see something like:
More Resources
For Linux Users
Linux has SSH built-in. If you use Linux, you probably already knew that. Here's how to use it:
- Open Terminal:
- Press
Ctrl + Alt + T(on most Linux systems) - Or search for "Terminal" in your applications menu
- Press
- Connect to your server:
- Type this command (replace
YOUR_IP_ADDRESSwith your actual server IP):
- Type this command (replace
ssh root@YOUR_IP_ADDRESSExample: If your server IP is 123.45.67.89, you would type:
ssh root@123.45.67.89- You'll see a security warning:
- The first time you connect, it will ask "Are you sure you want to continue connecting?"
- Type
yesand press Enter
- Enter your password:
- For Hetzner: If you did not provide an SSH key (we did not cover that here), Hetzner sends you a one time password via email. You will have to change it immediately after your first log-in (Linux will force you to change it).
- Important: When you type the password, you won't see any characters appear. This is normal! Just type and press Enter.
- For Hetzner: If you did not provide an SSH key (we did not cover that here), Hetzner sends you a one time password via email. You will have to change it immediately after your first log-in (Linux will force you to change it).
- You're connected!
- If successful, you'll see something like:
root@infinity-tools-server:~# - You're now controlling your server!
- If successful, you'll see something like:
Troubleshooting: Can't Connect?
Common issues and solutions:
- "Connection refused" or "Connection timed out":
- Check that your server is running in your cloud provider's dashboard
- Make sure you're using the correct IP address
- Wait a minute or two after creating the server - it might still be starting up
- "Permission denied":
- Double-check your password (remember, you won't see characters when typing)
- Make sure you're using
rootas the username - For DigitalOcean: Check your email - they send the password there
- "Host key verification failed":
- This happens if you've connected to a different server with the same IP before
- This is usually safe to ignore, but if you're concerned, ask for help
Step 2: Get the Infinity Tools Installer
You'll receive the Infinity Tools installer as a file that you need to transfer to your server. This file is usually named something like infinity-tools-installer.run.
Where to Get the Installer
The installer file will be provided to you through:
- Email attachment - Check your email for the installer file
- Download link - A secure download link will be sent to you
- USB drive - If you received a physical copy
Important: Make sure you have the installer file on your computer before proceeding!
Step 3: Transfer the Installer to Your Server
Now we need to get the installer file from your computer to your server. We'll use an FTP client - a program that helps you transfer files between computers.
What is an FTP Client?
An FTP client is a program that lets you upload files from your computer to your server. Think of it like copying a file from one folder to another, but over the internet.
Why we need it: Your server is in the cloud, so we need a way to send files to it. FTP clients make this easy and secure.
Recommended FTP Clients for Beginners
Here are some beginner-friendly FTP clients. Choose one that works with your computer:
For Windows Users
FileZilla (Recommended - Free)
- ✅ Very easy to use
- ✅ Free to download
- ✅ Works with Windows 10 and 11
- ✅ Has a simple drag-and-drop interface
How to get FileZilla:
- Go to filezilla-project.org
- Click "Download FileZilla Client"
- Download the Windows version
- Install it like any other program
WinSCP (Alternative - Free)
- ✅ Also very easy to use
- ✅ Free to download
- ✅ Good for Windows users
For Mac Users
Cyberduck (Recommended- Free)
- ✅ Very beginner-friendly
- ✅ Free to download
- ✅ Clean, simple interface
FileZilla (Alternative - Free)
- ✅ Works great on Mac
- ✅ Free to download
- ✅ Simple interface
For Linux Users
FileZilla (Recommended - Free)
- ✅ Available for most Linux distributions
- ✅ Free to download
- ✅ Easy to install
How to install FileZilla on Linux:
- Ubuntu/Debian:
sudo apt install filezilla - Fedora:
sudo dnf install filezilla - Arch Linux:
sudo pacman -S filezilla
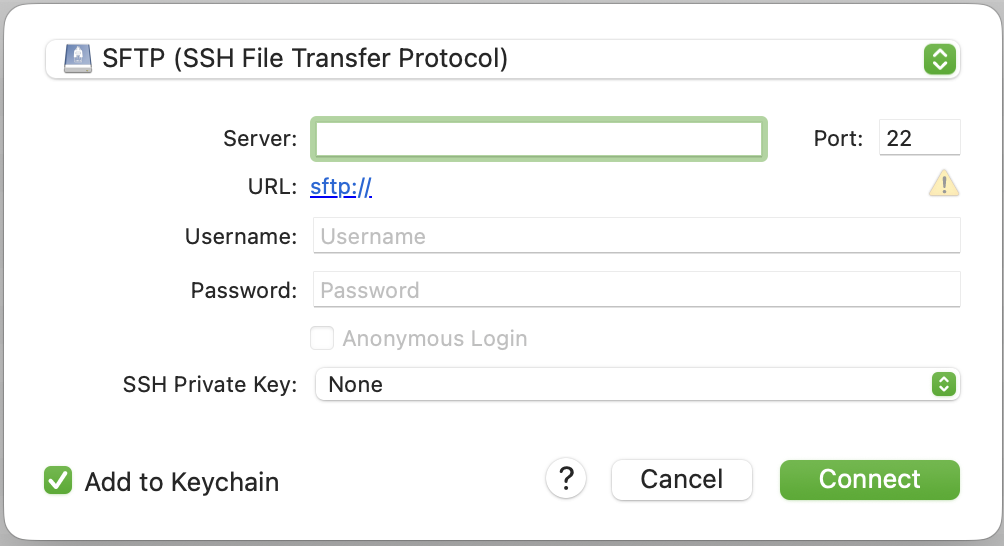
How to Use Cyberduck (Step-by-Step)
We'll use Cyberduck as an example, but other FTP clients work similarly:
- Open Cyberduck
- Connect to your server:
- Click
in the toolbar. This dialogue opens:

- Select "SFTP" in the dropdown menu on top
- Server: enter your server's IP address here, something like 192.168.1.0
- Port: this should be automatically set to 22 – that's just how it's supposed to be
- Username: the username you have used for SSH, so root@IP_ADDRESS
- Password: your SSH password
- Connect
- Click
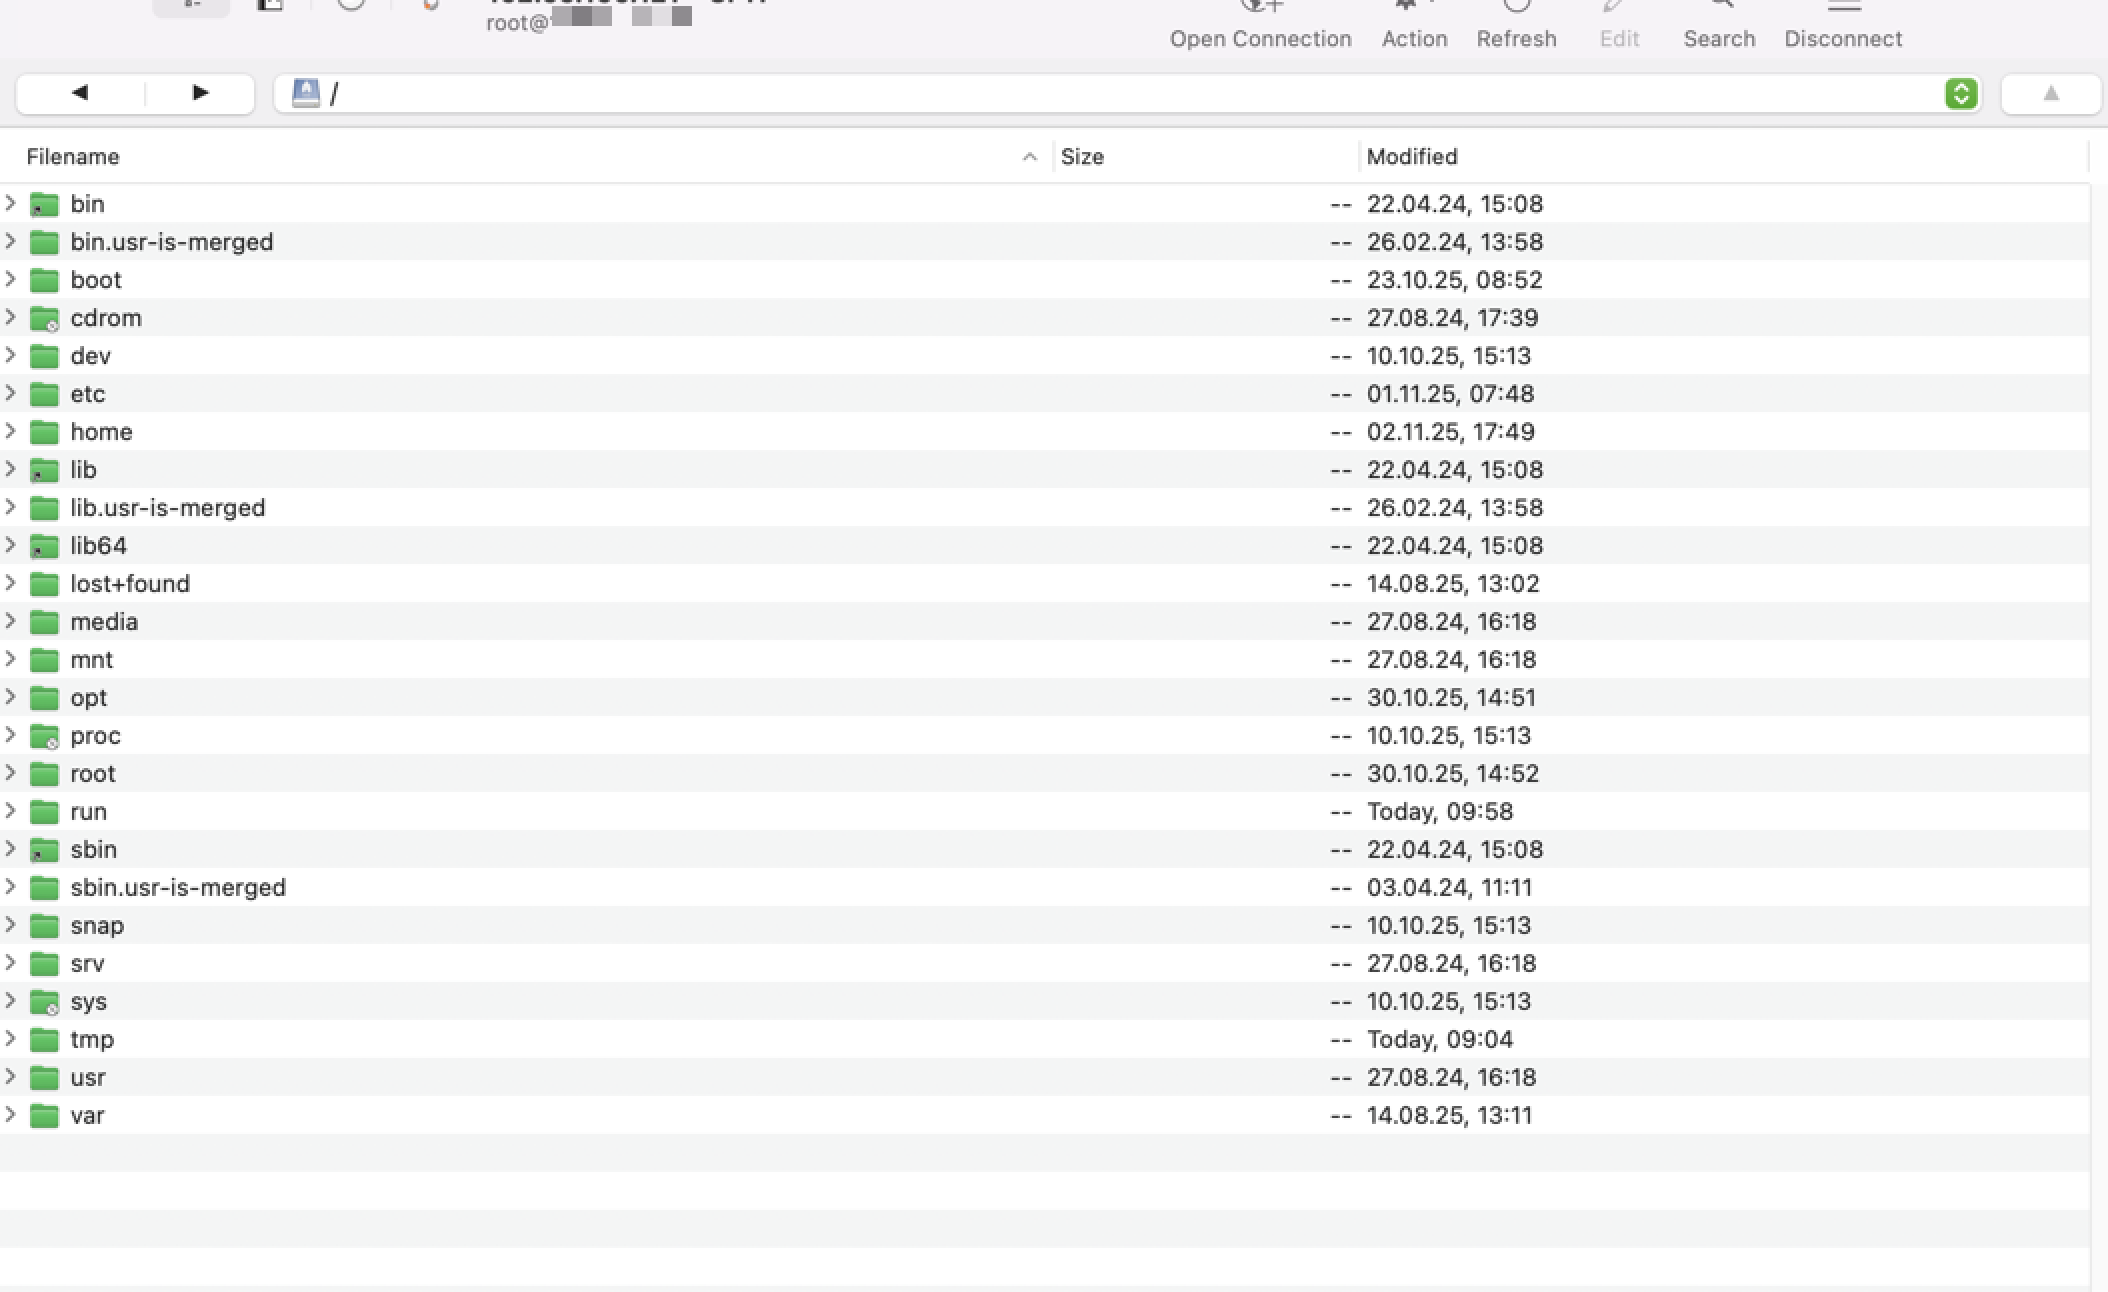
- After connection:
- You should see something like this:

- You should see something like this:
- Navigate to the right folder:
- On the right side (your server), double-click on
/to go to the root folder - Then double-click on
rootto go to your home folder
- On the right side (your server), double-click on
- Upload the installer:
- On the left side (your computer), find the installer file
- Right-click on the installer file
- Select "Upload" or drag it to the right side
- Wait for the upload to complete
Verify the Upload
After uploading, let's make sure the file is on your server. Go back to your SSH connection and type:
ls -lh infinity-tools*.runYou should see the installer file listed. If you see it, you're ready to continue!
Troubleshooting File Transfer
Can't connect to server:
- Double-check your server IP address
- Make sure you're using port 22
- Verify your username is
root - Check that your server is running
Upload fails:
- Make sure you have enough space on your server
- Check that you have permission to upload files
- Try uploading to a different folder (like
/tmp)
File not found after upload:
- Check that you uploaded to the right folder
- Look for the file in different locations
- Make sure the file name is correct
Step 4: Install Infinity Tools
Now comes the exciting part - installing Infinity Tools! The installer will set everything up for you automatically.
Make the Installer Executable
First, we need to tell Linux that this file can be run (executed). Type this command:
chmod +x infinity-tools*.runWhat this does: Makes the installer file executable (able to run)
Run the Installer
Now let's install Infinity Tools! Type this command:
sudo ./infinity-tools*.runWhat's happening:
sudomeans "run as administrator" - we need special permissions to install software./means "run the file in this directory"infinity-tools*.runmeans "the installer file we just downloaded"
During installation, you'll see:
- A welcome message from Infinity Tools
- Progress information as files are copied
- Dependencies being installed (like "gum" - a menu tool)
- A success message when it's done!
How long does it take? Usually 1-3 minutes, depending on your server's speed.
What Gets Installed
The installer automatically:
- ✅ Copies Infinity Tools to
/opt/InfinityTools/ - ✅ Creates a shortcut command called
infinity-tools - ✅ Sets up all necessary permissions
- ✅ Installs a menu tool (called "gum") for the interactive interface
Success Message
When installation completes, you'll see a message like:
✅ INSTALLATION SUCCESSFUL!

📝 Quick Start:
   • Run: sudo infinity-tools
   • Or:  cd /opt/InfinityTools && sudo bash start-tools.sh
If you see this message, congratulations! Infinity Tools is now installed on your server!
Step 5: Verify Installation
Let's make sure everything installed correctly. Type this command:
which infinity-toolsYou should see: /usr/local/bin/infinity-tools
This confirms the shortcut was created successfully!
Step 6: Run Infinity Tools for the First Time
Now for the moment you've been waiting for - let's start Infinity Tools!
Starting Infinity Tools
Type this command:
sudo infinity-toolsWhat happens:
- Infinity Tools will start loading
- You'll see a message like "🔧 Loading Infinity Tools components..."
- Then the main menu will appear!
What You'll See
When Infinity Tools starts, you'll see a beautiful menu with options like:
- 📱 APPS - SOFTWARE (to install applications)
- 🔐 SECURITY & NETWORKING (security tools)
- 🏗️ INFRASTRUCTURE & CORE SYSTEMS (Docker, etc.)
- 💾 BACKUP MANAGEMENT (backup tools)
- 📊 STATUS & HEALTH (check what's running)
First Steps in Infinity Tools
When you first start Infinity Tools, here's what to do:
- Check System Readiness:
- Infinity Tools might automatically check if your system is ready
- It will tell you if anything needs to be fixed
- Install Docker (if needed):
- Docker is required for most applications
- Go to "🏗️ INFRASTRUCTURE & CORE SYSTEMS" → "Install Docker"
- Follow the prompts - Infinity Tools will handle everything!
- Explore the Menu:
- Take some time to look around
- Don't worry - you can't break anything by just browsing!
- Each section has helpful descriptions
Congratulations! 🎉
You've successfully:
- ✅ Connected to your server via SSH
- ✅ Downloaded Infinity Tools
- ✅ Installed Infinity Tools
- ✅ Started Infinity Tools for the first time
You're now ready to use Infinity Tools!
What's Next?
Now that Infinity Tools is installed and running, you can:
- Install Docker (if not already installed) - Go to Infrastructure menu
- Install your first application - Choose from WordPress, Vaultwarden, Nextcloud, and more!
- Set up security - Configure firewall and security settings
- Configure backups - Set up automatic backups for your data
Quick Reference
Connecting to your server:
ssh root@YOUR_IP_ADDRESSStarting Infinity Tools:
sudo infinity-toolsWhere Infinity Tools is installed:
/opt/InfinityTools/If you need to run it manually:
cd /opt/InfinityTools
sudo bash start-tools.sh
Tips for Success
- Take your time: There's no rush. Explore the menu at your own pace.
- Read the prompts: Infinity Tools will guide you through each step.
- Don't worry about mistakes: Most actions can be undone or redone.
- Keep your server password safe: Write it down in a secure place.
- If something goes wrong: You can always reconnect and try again.
Troubleshooting
I Can't Connect to My Server
- Check that your server is running in your cloud provider's dashboard
- Verify you're using the correct IP address
- Make sure you're using the correct username (usually
root) - Wait a minute or two after creating the server - it might still be starting
The Installer Won't Run
- Make sure you used
sudobefore the command - Check that you ran
chmod +xon the installer file - Verify the file downloaded completely (check file size)
- Make sure you're in the directory where you downloaded the file
Infinity Tools Won't Start
- Make sure you're using
sudobefore the command - Check that installation completed successfully
- Verify with:
ls -la /opt/InfinityTools/(you should see files listed) - Try running manually:
cd /opt/InfinityTools && sudo bash start-tools.sh
I Lost Connection During Installation
- Don't worry! Just reconnect to your server
- Check if installation completed:
ls -la /opt/InfinityTools/ - If files are there, try running:
sudo infinity-tools - If installation didn't complete, just run the installer again
Security Note
Important: Your server is now accessible via SSH. To keep it secure:
- ✅ Always use strong passwords
- ✅ Don't share your server password with anyone
- ✅ Consider setting up SSH keys (more secure than passwords) - we'll cover this in a future chapter
- ✅ Keep your server updated
Infinity Tools can help with security too - check out the Security & Networking section in the menu!
You did it! Infinity Tools is now installed and ready to use. In the next chapters, you'll learn how to install your first applications and configure everything you need.
Next: Setting up your Foundation
Excourse: Domains and Subdomains
Infinity Tools helps you self-host everything—including your future WordPress site. Before you install Traefik or any applications, take a moment to decide how your domain should point to your server. In this chapter you'll set up your main domain (even if WordPress isn't running yet) and map out the subdomains each Infinity Tools app will use.
Why this chapter now? Getting DNS ready right after installing Infinity Tools (Chapter 2) means Traefik can issue certificates instantly, your apps come online with friendly URLs, and you won't have to pause mid-install to fix domain problems.
Decide Where Your Main Domain Should Go
Your main domain (also called the apex domain or root domain) is what people type to reach your primary site—for example, myinfinitytools.com. Most beginners following this guide want the main domain to load a WordPress site that they will install with Infinity Tools in Chapter 11.
No WordPress Yet? That's OK.
Even though WordPress isn't installed yet, point your main domain to the server where Infinity Tools runs. Until WordPress is live you'll see Traefik's default page (or a simple placeholder), which is perfectly fine.
You'll create two records now:
@→ your server's public IP address (A record)www→@(CNAME) so both reach the same place
Later, when you install WordPress with Traefik integration, Infinity Tools will automatically use these records to serve your new site over HTTPS.
What is a Subdomain?
A subdomain is like a separate address within your main website. Think of it as different rooms in the same house - each room has its own purpose, but they're all part of the same building.
Examples of subdomains:
vault.myinfinitytools.com- For your password managerfiles.myinfinitytools.com- For your file storageadmin.myinfinitytools.com- For your admin panel
Important Note:
From a security standpoint, it is considered poor practice to use obvious subdomain names (like “admin” or “files”) for sensitive services such as administration panels or data storage. Such names reveal potentially valuable targets to attackers during reconnaissance and were chosen here for illustration purposes.
Breaking Down a Subdomain
Let's look at vault.myinfinitytools.com:
- vault - This is the subdomain (the "room")
- myinfinitytools - This is your domain name (the "house")
- com - This is the top-level domain (the "neighborhood")
Why Do We Need Subdomains?
Subdomains help organize your services and make them easier to access:
- ✅ Easy to remember -
vault.mydomain.comis clear - ✅ Professional looking - Each service has its own address
- ✅ SSL certificates work better - Each subdomain gets its own certificate
- ✅ Easy to manage - You can move services around easily
Without subdomains: You'd have to use ports like mydomain.com:8080 or mydomain.com:3000 - much harder to remember!
Plan Your Subdomains
Start a simple list of the services you plan to run with Infinity Tools. These examples match the chapters you'll follow later. You can always add more subdomains later.
Security Services
vault.mydomain.com- Vaultwarden (Chapter 7)pass.mydomain.com- Passbolt (Chapter 8)vpn.mydomain.com- VPN or remote access gateway
File and Storage Services
files.mydomain.com- Nextcloud (Chapter 10)sync.mydomain.com- Syncthing (Chapter 9)backup.mydomain.com- Borgmatic status or backup dashboard
Web and Content Services
www.mydomain.com- Redirect to your main domain once WordPress is live (Chapter 11)blog.mydomain.com- Alternate marketing site or staging WordPressdocs.mydomain.com- Docs portal built with BookStack or similar
Monitoring and Analytics
stats.mydomain.com- Matomo analytics (Chapter 12)monitor.mydomain.com- Monitoring stack (Uptime Kuma, Grafana, etc.)status.mydomain.com- Public status page
How to Create Subdomains
The process varies by hosting provider, but the steps are always: point @ and www to your Infinity Tools server, then create matching records for every subdomain Traefik will serve.
Step 1: Get Your Server's IP Address
First, you need to know your server's IP address. You can find this in your server provider's dashboard or by running this command on your server:
curl ifconfig.meThis will show you your server's public IP address (something like 123.456.789.012).
Step 2: Access Your DNS Management
Log into your domain registrar or hosting provider and look for:
- DNS Management
- DNS Settings
- Domain Management
- Name Servers
Provider-Specific Instructions
Below are examples from popular registrars and DNS hosts. Interfaces may change, but the record types stay the same. Each provider follows the same basic pattern:
- Optionally, an A record for
@pointing to your Infinity Tools server IP — this makeshttps://yourdomain.comandhttps://www.yourdomain.comresolve to the server (for example, to host WordPress later).
Skip this step if your main website is hosted elsewhere and you only want to connect specific subdomains. - A CNAME record for
wwwpointing to@. - Individual A records for every service subdomain (e.g.
vault,files,monitor) pointing to your Infinity Tools server IP.
Note: The example IP 203.0.113.42 is for illustration only — replace it with your actual server IP.
Hetzner Cloud
If you manage DNS in Hetzner:
- Log into the Hetzner Cloud Console.
- Go to DNS and select your domain.
- Click Add record → choose A → set Name to
@and Value to your server IP → Save. - Add a CNAME record with Name
wwwpointing to@. - Repeat Add record → A for each service subdomain (e.g.,
vault,files) and set the same server IP.
Example: To prepare WordPress for the main domain and Vaultwarden on vault.myinfinitytools.com:
@→203.0.113.42(A record)www→@(CNAME)vault→203.0.113.42(A record)
Cloudflare
If you proxy traffic through Cloudflare:
- Log into the Cloudflare Dashboard.
- Select your domain and open DNS → Records.
- Click Add record → choose A → set Name to
@, IPv4 address to your server IP, TTL Auto, Proxy status Off (DNS only) while testing → Save. - Add a CNAME record for
wwwpointing to@. - Add individual A records for each service subdomain (e.g.,
files,vault) pointing to the same IP. You can enable the orange-cloud proxy after confirming Traefik and certificates work.
Namecheap
If you registered your domain with Namecheap:
- Log into your Namecheap account.
- Open Domain List → click Manage next to your domain.
- Go to the Advanced DNS tab.
- Under Host Records, click Add New Record → choose A Record → set Host to
@, Value to your server IP, TTL Automatic → Save. - Add a CNAME Record with Host
wwwand Value@. - Add more A Records for each service subdomain (e.g.,
vault,files) pointing to the same IP.
GoDaddy
If you're using GoDaddy DNS:
- Log into your GoDaddy account.
- Open My Products → locate your domain → click DNS.
- Click Add in the Records section, choose A, set Name to
@, Value to your server IP, TTL 1 Hour → Save. - Add a CNAME record with Name
wwwpointing to@. - Add more A records for each service subdomain (Name =
vault,files, etc.; Value = server IP).
Porkbun
If you manage DNS with Porkbun:
- Log into the Porkbun Domain Management panel.
- Click Details next to your domain.
- In Quick DNS Config, click Edit.
- Add an A record with Host
@and Answer = your server IP. - Add a CNAME record with Host
wwwand Answer@. - Add more A records for each service subdomain (Host =
vault,files, etc.; Answer = server IP). - Click Save Changes.
Google Domains / Squarespace Domains
If your domain is managed in Google Domains (now Squarespace):
- Sign in at domains.google.
- Select your domain and open the DNS tab.
- Under Custom records, click + Add record.
- Choose A, set Name to
@, Data to your server IP, TTL to the default → Save. - Add a CNAME with Name
wwwand Data@. - Add more A records for each service subdomain (
vault,files, etc.) pointing to the same IP.
OVHcloud
If you manage DNS at OVH:
- Log into the OVHcloud Manager.
- Go to Domains → select your domain → DNS zone.
- Click Add an entry → choose A → set Sub-domain to
@and Target to your server IP → confirm. - Add another entry: Type CNAME, Sub-domain
www, Targetyourdomain.com.(OVH will append the dot automatically). - Add additional A entries for each service subdomain (
vault,files, etc.) pointing to the same IP.
Understanding DNS Propagation
After creating a subdomain, it takes time for the change to spread across the internet. This is called DNS propagation.
How Long Does It Take?
- Usually: 5-30 minutes
- Sometimes: Up to 24 hours
- Rarely: Up to 48 hours
How to Check if It's Working
You can test if your subdomain is working by visiting it in your browser:
- Go to
https://vault.yourdomain.com - If you see a page (even an error), the subdomain is working
- If you get "This site can't be reached", it's still propagating
Testing with Command Line
You can also test from your server:
# Test if subdomain resolves
nslookup vault.yourdomain.com

# Test if it points to your server
dig vault.yourdomain.com
Create Your Domain Checklist
Before installing applications, map out every DNS record you want in place. This keeps your launch organized and helps you avoid downtime on your main site.
Essential Records
These are the records most beginners configure on day one:
@→ Your Infinity Tools server IP (WordPress will live here later)www→ CNAME pointing to@vault.yourdomain.com→ Your server IP for Vaultwardenfiles.yourdomain.com→ Your server IP for Nextcloud or file storage
Optional Subdomains
Add these after your core services are live:
blog.yourdomain.com→ Alternate blog or marketing siteadmin.yourdomain.com→ Admin panel (use with caution, see security tips)sync.yourdomain.com→ File synchronization endpointstats.yourdomain.com→ Analytics tools like Matomomonitor.yourdomain.com→ Monitoring dashboardsbackup.yourdomain.com→ Backup management interface
Best Practices
Naming Conventions
- ✅ Use descriptive names -
vaultinstead ofapp1 - ✅ Keep them short -
filesinstead offile-storage-system - ✅ Use lowercase -
vaultnotVault - ✅ Avoid special characters - No spaces, symbols, or accents
Security Considerations
- ✅ Don't use obvious names - Avoid
adminfor sensitive services - ✅ Use random names for sensitive services -
a7b9c2instead ofadmin - ✅ Document your subdomains - Keep a list of what each one does
Troubleshooting
Subdomain Not Working
If your subdomain isn't working:
- Check the DNS record - Make sure it points to the right IP
- Wait for propagation - Give it 30 minutes to an hour
- Check for typos - Make sure the subdomain name is correct
- Test with different tools - Try
nslookupor online DNS checkers
Common Mistakes
- ❌ Including the full domain in the host field - Use
vaultnotvault.mydomain.com - ❌ Pointing your main domain to the wrong place - Double-check WordPress instructions before editing
@andwww - ❌ Wrong IP address - Make sure you're using your server's public IP
- ❌ Wrong record type - Use "A" record, not "CNAME" for IP addresses
- ❌ Not saving the record - Make sure to click "Save" after creating
Quick Reference
Find your server IP:
curl ifconfig.meVerify your main domain record:
nslookup yourdomain.comTest subdomain resolution:
nslookup vault.yourdomain.comTest from browser:
https://vault.yourdomain.comTip: Until WordPress or another app is installed you'll likely see Traefik's default page at your main domain. That's expected.
You're Ready!
Now you understand how to prepare both your main domain and subdomains! This knowledge will be essential as you install applications like Vaultwarden, Nextcloud, and connect your WordPress site.
What you learned:
- ✅ How to point your main domain - Aim it at your Infinity Tools server so WordPress is ready to launch
- ✅ What subdomains are - Separate addresses for different services
- ✅ How to plan them - Build a checklist before installing apps
- ✅ How to create DNS records - Step-by-step instructions for popular providers
- ✅ How to test everything - Browser and command-line methods
Next step: Move on to Chapter 3 (Setting Up Your Foundation). Keep this checklist handy—each time you install an app, add or confirm the subdomain you planned.
What You Learned
- Main domain setup - How to point
@andwwwto your Infinity Tools server - Subdomains - Separate addresses for different services on your domain
- DNS Records - How to point each subdomain to your server
- DNS Propagation - How long it takes for changes to take effect
- Testing Methods - How to verify both main and subdomains are working
- Planning - How to organize your services with a checklist
You now have the foundation knowledge needed to set up professional-looking, organized services on your server!
Next: Chapter 3 - Setting Up Your Foundation.
Foundations
These apps are more or less essential. You need Traefik for many other apps to run properly; you should also seriously think about backup if you do anything mission critical with this server or store data on it.
3: Setting Up Your Foundation
Before you can install your first application, we need to set up the basic infrastructure that Infinity Tools needs to work properly. Don't worry - Infinity Tools will handle most of this automatically!
This chapter also covers foundational apps that most Infinity Tools require—the most essential of them is Traefik, on which many other apps rely. You do not strictly need the back-tool Borgmatic, however, we highly recommend that you install it to automatically create backups of your data. And to use Borgmatic, you have to install Apprise, a notification system, which is why we also cover it in this chapter.
What We'll Set Up
In this chapter, we'll prepare:
- ✅ Docker - The system that runs all your applications
- ✅ Docker Network - How applications talk to each other
- ✅ System Requirements - Making sure everything is ready
- ✅ Basic Security - Simple firewall setup (optional)
Time needed: About 10-15 minutes
What is Docker? (Simple Explanation)
Docker is like a shipping container system for software. Just like how shipping containers make it easy to move goods around the world, Docker makes it easy to run applications on any computer.
Why we need it:
- Applications run in isolated "containers" - they can't interfere with each other
- Everything is pre-configured and ready to go
- If something goes wrong, you can easily restart or replace just that application
- It's the standard way modern applications are deployed
Think of it like this: Instead of installing WordPress directly on your server (which can be complicated), Docker runs WordPress in a container that has everything it needs already set up. If you install Portainer, you get a convenient web app to see what's going on with your Docker containers and administrate them.
Step 1: Run the Readiness Check
Infinity Tools has a built-in system that checks if everything is ready and installs what's missing. Let's run it!
Start Infinity Tools
First, make sure you're connected to your server via SSH, then start Infinity Tools:
sudo infinity-toolsWhat You'll See in the GUI
When you start Infinity Tools, you'll see a beautiful, modern interface with:
- ✅ Colorful headers - Easy to identify different sections
- ✅ Progress indicators - Shows what's happening during installation
- ✅ Status messages - Tells you if things are working or if there are problems
- ✅ Interactive prompts - Asks you questions when needed
Don't worry if it looks complex! The GUI is designed to guide you through everything step by step.
What Happens Next
Infinity Tools will automatically run a "readiness check" that:
- Checks if Docker is installed
- Installs Docker if it's missing
- Sets up the Docker network
- Installs other required tools
- Verifies everything is working
You'll see messages like:
♾️  INFINITY TOOLS READINESS CHECK

Ensuring all prerequisites are met...

This will check and install:
• Docker & Docker Compose
• Docker Network for services
• GUM for modern UI
• Dialog for compatibility
• System requirements
If Docker Needs to be Installed
If Docker isn't installed yet, you'll see a message asking if you want to install it:
🐳 DOCKER INSTALLATION REQUIRED

Infinity Tools requires Docker to run containerized services.

Docker will be installed and configured automatically.
This includes Docker Engine and Docker Compose.

⚠️  This requires internet connection and may take a few minutes.

Install Docker now?
Answer "Yes" to continue. The installation will take a few minutes.
Docker Network Setup
After Docker is installed, you'll be asked about setting up a network:
🌐 DOCKER NETWORK SETUP

Infinity Tools services need a Docker network to communicate.

This network allows containers to find each other by name
and enables features like Traefik reverse proxy.

Default network name: proxy
Press Enter to use the default network name "proxy" (recommended).
Step 2: Verify Everything is Working
After the readiness check completes, you should see:
✅ READINESS CHECK COMPLETE

All prerequisites are satisfied!
Infinity Tools is ready to use.
What Was Installed
If everything went well, you now have:
- ✅ Docker Engine - The main Docker system
- ✅ Docker Compose - Tool for managing multiple containers
- ✅ Docker Network - A network called "proxy" for your services
- ✅ GUM - The modern interface you're using
- ✅ Dialog - Backup interface (just in case)
Step 3: Understanding What Happened
Docker Installation
Docker was installed and configured to:
- Start automatically when your server boots
- Run containers securely
- Manage storage for your applications
- Handle networking between containers
Docker Network
The "proxy" network was created to:
- Allow applications to find each other by name
- Enable Traefik (our reverse proxy) to route traffic
- Keep your applications isolated from the internet
- Make it easy to add new services later
Step 4: Optional - Basic Security Setup
Now that the basics are ready, you can optionally set up basic security. This is recommended but not required to get started.
What is a Firewall?
A firewall is like a security guard for your server. It controls which connections are allowed in and out.
Why it's important: Without a firewall, your server is like a house with all doors unlocked - anyone can try to access it.
Setting Up the Firewall
In the Infinity Tools menu, you'll see a "Security & Networking" section. You can set up the firewall later, but here's what it does:
- Allows SSH connections (so you can still connect)
- Allows HTTP and HTTPS traffic (for websites)
- Blocks other unwanted connections
- Protects against common attacks
For now: You can skip this and set it up later. Your server is reasonably safe as long as you keep your passwords strong.
Step 5: Understanding Your System
What's Running Now
Right now, your server has:
- ✅ Infinity Tools - The management system
- ✅ Docker - Ready to run applications
- ✅ Docker Network - Ready for services
- ❌ No Applications Yet - This is what we'll install next!
What's Next
You're now ready to install your first application! The most important one to install first is Traefik - it handles secure connections and routing for all your other applications.
Troubleshooting
Docker Installation Failed
If Docker installation fails:
- Check your internet connection
- Make sure you have enough disk space (at least 1GB free)
- Try running the readiness check again
- If it keeps failing, contact support with the error message
Network Creation Failed
If the Docker network creation fails:
- Make sure Docker is running:
sudo systemctl status docker - Try restarting Docker:
sudo systemctl restart docker - Run the readiness check again
Can't Connect to Server
If you lose connection during setup:
- Reconnect via SSH
- Run
sudo infinity-toolsagain - The readiness check will continue where it left off
Quick Reference
Check if Docker is running:
sudo systemctl status dockerCheck Docker networks:
docker network lsView Docker containers:
docker psRestart Docker if needed:
sudo systemctl restart dockerYou're Ready!
Congratulations! You now have:
- ✅ A working Docker system
- ✅ A network for your applications
- ✅ All the tools Infinity Tools needs
- ✅ A solid foundation for your applications
Next step: Install Traefik - the reverse proxy that will handle secure connections and routing for all your applications.
What You Learned
- Docker - A system for running applications in containers
- Docker Network - How applications communicate with each other
- Readiness Check - Infinity Tools' automatic setup system
- Infrastructure - The foundation that makes everything else possible
You're now ready to install your first application! In the next chapter, we'll install Traefik, which is essential for running other applications securely.
Next: Installing Traefik - Your Reverse Proxy (Chapter 4)
4: Traefik - Reverse Proxy (essential)
Now that your infrastructure is ready, it's time to install Traefik - the most important service you'll set up. Traefik handles secure connections and routing for all your other applications.
What is Traefik? (Simple Explanation)
Traefik is like a smart traffic director for your server. Think of it as a receptionist at a large office building who:
- Greets visitors (web traffic) at the front door
- Checks their ID (verifies security certificates)
- Directs them to the right office (routes traffic to the correct application)
- Makes sure they use the secure elevator (forces HTTPS)
Why Traefik is essential:
- ✅ Automatic SSL certificates - Makes your websites secure (HTTPS)
- ✅ Domain routing - Directs traffic to the right application
- ✅ Security - Protects your applications from direct internet access
- ✅ Required by other apps - Most Infinity Tools applications need Traefik
Why Install Traefik First?
Traefik should be installed before any other application because:
- Other apps depend on it - Many applications will ask if you want to use Traefik
- SSL certificates - It handles secure connections for all your services
- Domain management - It routes traffic based on your domain names
- Security foundation - It provides a secure gateway to your applications
Without Traefik: You'd have to manually configure SSL certificates and routing for each application - a complex and time-consuming process.
What You'll Need
Before installing Traefik, make sure you have:
- ✅ Docker installed (from Chapter 3)
- ✅ Docker network set up (from Chapter 3)
- ✅ A domain name (optional but recommended)
- ✅ An email address (for SSL certificate notifications)
About Domain Names
What is a domain name? It's like your website's address (e.g., mywebsite.com).
Why you need one: Traefik uses your domain name to create SSL certificates and route traffic. Without one, you can still use Traefik, but you'll get security warnings in your browser.
Examples of domain names:
myinfinitytools.commyserver.example.comhome.mydomain.net
Don't have a domain? That's okay! You can still install Traefik and add a domain later, or use your server's IP address directly.
Step 1: Start Infinity Tools
Make sure you're connected to your server via SSH, then start Infinity Tools:
sudo infinity-toolsStep 2: Navigate to Traefik Installation
In the Infinity Tools menu, you'll see several sections. Look for:
- 🔐 SECURITY & NETWORKING - This is where Traefik is located
Use your arrow keys to navigate to this section and press Enter.
Using the Infinity Tools GUI
The Infinity Tools interface makes everything easy to find and use:
- ✅ Color-coded sections - Each category has its own color
- ✅ Clear descriptions - Hover over options to see what they do
- ✅ Status indicators - Shows if services are running or stopped
- ✅ Progress bars - Shows installation progress in real-time
Look for the turquoise cursor - it shows exactly what you're about to select!
Step 3: Install Traefik
In the Security & Networking menu, you'll see:
- Install Traefik - This is what you want
Select "Install Traefik" and press Enter.
What Happens During Installation
Traefik installation will:
- Create a configuration file
- Set up SSL certificate management
- Create a Docker container
- Configure the reverse proxy
- Start the service
This usually takes 1-2 minutes.
Step 4: Configure Traefik
During installation, you'll be asked a few questions:
Email Address for SSL Certificates
You'll see a prompt like:
Enter email address for SSL certificates:
[admin@example.com]
What to enter: Use a valid email address you check regularly. This is used for SSL certificate notifications and warnings.
Examples:
admin@myinfinitytools.comyour-email@gmail.comnotifications@yourdomain.com
Domain Name (Optional)
If you have a domain name, you'll be asked:
Enter your domain name (or press Enter to skip):
[myinfinitytools.com]
If you have a domain: Enter it here (e.g., myinfinitytools.com)
If you don't have a domain: Press Enter to skip - you can add this later
IPv6 Configuration
You might be asked about IPv6 support:
Do you want to enable IPv6 support?
Y) Yes - Enable both IPv4 and IPv6
N) No - IPv4 only (recommended for beginners)
For beginners: Choose "N" (No) - IPv4 only is simpler and works fine for most use cases.
Step 5: Wait for Installation
After answering the questions, Traefik will install and start. You'll see messages like:
📦 Installing Traefik...
🔧 Creating configuration...
🌐 Starting Traefik container...
✅ Traefik installed successfully!
Step 6: Verify Traefik is Working
After installation completes, let's make sure Traefik is running properly.
Check Traefik Status
In the Infinity Tools menu, go to:
- 📊 STATUS & HEALTH → STATUS
You should see Traefik listed as "RUNNING" or "ACTIVE".
Using the Status Dashboard
The Status & Health section gives you a complete overview of your system:
- ✅ Service Status - Shows which applications are running
- ✅ System Health - CPU, memory, and disk usage
- ✅ Docker Info - All your containers and their status
- ✅ Network Status - Shows your Docker networks
Look for the green checkmarks - they indicate everything is working properly!
Check Docker Containers
You can also check by going to:
- 📊 STATUS & HEALTH → DOCKER INFO
Look for a container named "traefik" - it should be running.
Understanding the Docker Info Screen
The Docker Info section shows you:
- 🐳 Container Name - What the container is called
- 📊 Status - Running, stopped, or restarting
- 🌐 Ports - Which ports the container is using
- 💾 Memory Usage - How much RAM it's using
Green status means everything is working! Red or yellow means there might be an issue.
Step 7: Understanding What Was Created
Traefik installation creates several important files and configurations:
Configuration Files
Traefik stores its configuration in:
/opt/speedbits/traefik/traefik.yml- Main configuration/opt/speedbits/traefik/docker-compose.yml- Docker setup
SSL Certificates
SSL certificates are stored in:
/opt/speedbits/traefik/letsencrypt/- Let's Encrypt certificates
Docker Container
Traefik runs as a Docker container that:
- Listens on ports 80 (HTTP) and 443 (HTTPS)
- Automatically redirects HTTP to HTTPS
- Manages SSL certificates
- Routes traffic to your applications
Step 8: Test Traefik (If You Have a Domain)
If you configured a domain name, you can test Traefik by visiting your domain in a web browser.
What You Should See
When you visit your domain, you should see:
- A secure connection (HTTPS) - look for the lock icon in your browser
- Either a "404 Not Found" page (normal - no apps installed yet) or a Traefik dashboard
If You Don't Have a Domain
You can still test Traefik by visiting your server's IP address:
- Visit
http://YOUR_SERVER_IPin your browser - It should redirect to
https://YOUR_SERVER_IP - You'll see a security warning (normal without a domain)
What's Next?
Congratulations! You now have Traefik installed and running. This means:
- ✅ SSL certificates are automatically managed
- ✅ Secure connections are enforced
- ✅ Domain routing is ready
- ✅ Other applications can now be installed
Ready for Applications
Now you can install any of the applications in Infinity Tools:
- WordPress - For websites and blogs
- Vaultwarden - For password management
- Nextcloud - For file storage and sharing
- And many more!
When you install these applications, they'll automatically work with Traefik to provide secure, domain-based access.
Troubleshooting
Traefik Won't Start
If Traefik fails to start:
- Check that Docker is running:
sudo systemctl status docker - Check Docker logs:
docker logs traefik - Verify the configuration:
cat /opt/speedbits/traefik/traefik.yml - Try restarting:
docker restart traefik
SSL Certificate Issues
If SSL certificates aren't working:
- Make sure your domain points to your server's IP address
- Check that ports 80 and 443 are open
- Wait a few minutes for certificates to be issued
- Check Traefik logs:
docker logs traefik | grep -i acme
Can't Access Traefik
If you can't access Traefik:
- Check that Traefik is running:
docker ps | grep traefik - Verify ports are open:
sudo ss -tulnp | grep :80 - Check firewall settings
- Try accessing via IP address instead of domain
Quick Reference
Check Traefik status:
docker ps | grep traefikView Traefik logs:
docker logs traefikRestart Traefik:
docker restart traefikCheck SSL certificates:
ls -la /opt/speedbits/traefik/letsencrypt/You're Ready!
Traefik is now installed and running! This is the foundation that makes all your other applications work securely and efficiently.
What you accomplished:
- ✅ Installed and configured Traefik
- ✅ Set up automatic SSL certificate management
- ✅ Created a secure gateway for your applications
- ✅ Prepared your system for other applications
Next step: You can now install any application from the Infinity Tools menu. Each application will automatically work with Traefik to provide secure, domain-based access.
What You Learned
- Traefik - A reverse proxy that handles SSL and routing
- SSL Certificates - Automatic security certificates for your domains
- Domain Routing - How traffic is directed to the right application
- Infrastructure Foundation - The base layer that supports all other services
You now have a solid foundation for running secure, professional applications on your server!
Next: Installing Your First Application (Coming Soon)
5 Apprise - Notifications (optional, but essential for backups with Borgmatic)
Apprise sends notifications about your server and applications (e.g., backup success/failure). It supports email, Slack, Telegram, and 90+ providers. For detailed provider setup, see the official Apprise documentation.
Why Apprise?
- ✅ Essential for backups - Borgmatic uses Apprise for alerts
- ✅ Many providers - Email, Slack, Discord, Telegram, etc.
- ✅ Simple - One container, easy configuration
Prerequisites
- ✅ Traefik installed (Chapter 4)
- ✅ Docker running (Chapter 3)
- ✅ Optional: Subdomain (Chapter 4.5), e.g.,
notify.yourdomain.com
Step 1: Start Infinity Tools
sudo infinity-toolsStep 2: Install Apprise
- Go to 📱 APPLICATIONS
- Select Apprise
- Choose Install Apprise
Using the Infinity Tools GUI
- Use ↑/↓ to move, Enter to select, Esc to go back
- Look for the turquoise cursor indicating the current selection
- Each screen shows a short description at the top explaining what’s needed
Step 2.1: Choose SSL Mode
You’ll see three options. Here’s what each means and when to use it:
- Traefik (recommended)
- What it is: Uses your domain name with a trusted HTTPS certificate from Let’s Encrypt
- What you need: A subdomain (e.g.,
notify.yourdomain.com) pointing to your server (see Chapter 4.5) - What you get: No browser warnings, a clean URL like
https://notify.yourdomain.com/notify - Pick this if: You plan to use Apprise over the internet or want the simplest, secure setup
- Standalone HTTPS (self‑signed)
- What it is: Uses HTTPS with a self‑signed certificate (your browser will warn it’s not trusted)
- What you need: Just a free port (e.g., 8099)
- What you get: URL like
https://SERVER_IP:8099/notifywith a warning you must accept once - Pick this if: You only use Apprise inside your own network and don’t want to set up a domain yet
- Standalone HTTP (not encrypted)
- What it is: No encryption. Data is sent in plain text
- What you need: A free port (e.g., 8098)
- What you get: URL like
http://SERVER_IP:8098/notify - Pick this only if: You’re testing temporarily on a private network and never expose it to the internet
Simple rule of thumb: Use Traefik if you have a domain; use Standalone HTTPS for quick local use; avoid HTTP on the internet.
Step 2.2: If You Choose Traefik
- Enter your subdomain, e.g.,
notify.yourdomain.com - Ensure the subdomain’s DNS A record points to your server (see Chapter 4.5)
- Infinity Tools will configure HTTPS automatically via Let’s Encrypt
After install: Your endpoint will be https://notify.yourdomain.com/notify
Step 2.3: If You Choose Standalone
- Pick a port (suggested defaults appear on screen)
- HTTPS (self‑signed): e.g.,
8099→https://SERVER_IP:8099/notify - HTTP: e.g.,
8098→http://SERVER_IP:8098/notify
- HTTPS (self‑signed): e.g.,
- Accept the browser warning if using self‑signed HTTPS
Where to Find the URL After Install
- On the finish screen, Infinity Tools prints the access URL
- You can also see it in 📊 STATUS & HEALTH → STATUS
What Happens
- Apprise container is created
- Optional domain + Traefik HTTPS routing
- Service is exposed for local HTTP API calls
Step 3: Configure a Notification
Set your first notification target (example: email). You can add more later.
Example: Email (SMTP)
Collect: SMTP host, username, password, from address.
- Provider URL example:
mailtos://USERNAME:PASSWORD@SMTP_HOST:587/?from=from@yourdomain.com&to=you@example.com - Store this URL safely; you’ll paste it where notifications are configured (e.g., Borgmatic)
Test a Notification
- Find your Apprise endpoint (e.g.,
http://apprise:8000/notifyor your domain) - Send a test:
curl -X POST "http://apprise:8000/notify" \ -d "title=Test" \ -d "body=Hello from Apprise" \ -d "url=YOUR_PROVIDER_URL" - Confirm you received the notification
Where It’s Used
- Borgmatic: Backup success/failure/security alerts
- Other tools: Can post to the same endpoint
Troubleshooting
- Check container logs:
docker logs apprise - Verify provider URL syntax (see official docs)
- Confirm network access to your SMTP/notification provider
You're Ready
Apprise is now running. Next, install Borgmatic (Chapter 6) so your backups can send notifications.
6: Borgmatic - Backup System (optional, but you should have backup)
Borgmatic is an automated backup system that keeps your data safe by creating encrypted, compressed backups of all your applications and databases. It's like having a digital safety net that automatically saves copies of everything important. For comprehensive configuration options and advanced features, please refer to the official Borgmatic documentation.
What is Borgmatic? (Simple Explanation)
Borgmatic is like a smart, automated filing system that makes copies of all your important data. Think of it as having a personal assistant who:
- Makes copies of all your files and databases
- Compresses them to save space
- Encrypts them for security
- Keeps multiple versions (daily, weekly, monthly)
- Runs automatically on a schedule
Why Borgmatic is essential:
- ✅ Data protection - Your data is safe if something goes wrong
- ✅ Automatic backups - Runs without you remembering
- ✅ Space efficient - Only stores changes, not duplicates
- ✅ Encrypted storage - Your backups are secure
- ✅ Easy recovery - Restore files when you need them
Think of it like this: If your server was a house, Borgmatic would be like having a professional photographer who takes a complete photo of every room every day, stores the photos safely, and can help you rebuild the house exactly as it was if something happens.
Interdependencies
Required: Borgmatic uses Apprise for notifications (success/failure/security alerts). Install Apprise first via 📱 APPLICATIONS → Apprise → Install.
Prerequisites
Before installing Borgmatic, make sure you have:
- ✅ Infinity Tools installed (from Chapter 2)
- ✅ Docker running (from Chapter 3)
- ✅ Traefik installed (from Chapter 4)
- ✅ Apprise installed (notifications dependency)
- ✅ Storage space - At least 2-3 times your data size
Why These Prerequisites Matter
Infinity Tools: Provides the management interface for Borgmatic
Docker: Runs Borgmatic in a secure container
Traefik: Provides secure access to backup management
Storage space: Backups need somewhere to be stored
Step 1: Start Infinity Tools
Make sure you're connected to your server via SSH, then start Infinity Tools:
sudo infinity-toolsUsing the Infinity Tools GUI
When you start Infinity Tools, you'll see the main menu. Look for the 💾 BACKUP MANAGEMENT section - this is where Borgmatic is located.
- ✅ Color-coded sections - Backup tools have their own section
- ✅ Clear descriptions - Each tool shows what it does
- ✅ Status indicators - Shows if backup systems are running
- ✅ Easy navigation - Use arrow keys to move around
Step 2: Navigate to Borgmatic
In the Infinity Tools menu:
- Use your arrow keys to navigate to 💾 BACKUP MANAGEMENT
- Press Enter to open the Backup Management menu
- Look for Borgmatic in the list
- Select it and press Enter
Understanding the Backup Management Section
The Backup Management section contains tools for protecting your data:
- 💾 Borgmatic - Automated backup system
- 📊 Backup Status - Check what's being backed up
- 🔧 Backup Settings - Configure backup options
- 📁 Restore Data - Recover files when needed
Look for the turquoise cursor - it shows what you're about to select!
Step 3: Install Borgmatic
When you select Borgmatic, you'll see installation options. Choose Install Borgmatic.
What Happens During Installation
Borgmatic installation will:
- Create a backup container
- Set up two backup schedules (files and databases)
- Configure encryption for security
- Set up automatic notifications
- Create security monitoring (canary files)
This usually takes 3-5 minutes.
Step 4: Configure Borgmatic
During installation, you'll be asked several questions:
Backup Schedule
You'll see a prompt like:
📅 Backup Schedule Configuration
=============================
How often should files be backed up?

1) Daily (default) - Once per day at 2:00 AM
2) Twice daily - Every 12 hours
3) Weekly - Once per week on Sunday
For beginners: Choose "1" (Daily) - This provides good protection without using too much storage.
Retention Policy
You'll be asked how long to keep backups:
📦 Retention Policy
================
How long should backups be kept?

1) Conservative (default) - 7 daily, 4 weekly, 6 monthly
2) Aggressive - 14 daily, 8 weekly, 12 monthly
3) Minimal - 3 daily, 2 weekly, 3 monthly
For beginners: Choose "1" (Conservative) - This keeps enough backups for recovery without using too much space.
Compression Settings
You'll be asked about compression:
🗜️  Compression Configuration
===========================
Choose compression algorithm:

1) zstd (default) - Best balance of speed and compression
2) lz4 - Fastest compression, larger files
3) zlib - Good compression, moderate speed
4) lzma - Best compression, slower
For beginners: Choose "1" (zstd) - This provides good compression without being too slow.
Security Passphrase
You'll be asked to create a passphrase for your backups:
🔐 Security Configuration
======================
Enter a strong passphrase for backup encryption:
[Enter your passphrase]
Important: This passphrase encrypts your backups. Choose something strong and save it safely!
Passphrase tips:
- At least 12 characters long
- Mix of letters, numbers, and symbols
- Easy for you to remember
- Unique (don't use it anywhere else)
Example: MyBackup@2024!Secure#Data
Step 5: Wait for Installation
After answering the questions, Borgmatic will install and start. You'll see messages like:
📦 Installing Borgmatic...
🔧 Creating backup configurations...
🔐 Setting up encryption...
🛡️  Creating security monitoring...
📅 Setting up schedules...
✅ Borgmatic installed successfully!
Step 6: Understanding What Was Created
Borgmatic installation creates a sophisticated backup system with two types of backups:
File Backups
These backup all your application files:
- What's backed up: All files in
/opt/speedbits/ - Schedule: Daily (or your chosen frequency)
- Retention: 7 daily, 4 weekly, 6 monthly
- Purpose: Recover application configurations and data
Database Backups
These backup all your databases:
- What's backed up: MariaDB, PostgreSQL, SQLite, MongoDB databases
- Schedule: Every 6 hours
- Retention: 48 hourly, 7 daily
- Purpose: Recover database data quickly
Security Features
Borgmatic includes advanced security:
- ✅ Encryption - All backups are encrypted
- ✅ Canary files - Detects if your system is compromised
- ✅ Notifications - Alerts you about backup status
- ✅ Deduplication - Only stores changes, saving space
Step 7: Verify Borgmatic is Working
Let's make sure Borgmatic is running properly.
Check Status in Infinity Tools
In the Infinity Tools menu, go to:
- 📊 STATUS & HEALTH → STATUS
You should see Borgmatic listed as "RUNNING" or "ACTIVE".
Using the Status Dashboard
The Status & Health section shows you:
- ✅ Service Status - Which applications are running
- ✅ System Health - CPU, memory, and disk usage
- ✅ Docker Info - All your containers and their status
- ✅ Backup Status - When backups last ran
Look for the green checkmarks - they indicate everything is working properly!
Check Backup Status
You can also check by going to:
- 💾 BACKUP MANAGEMENT → Backup Status
This will show you:
- 📅 Last Backup - When backups last ran
- 📊 Backup Size - How much space backups use
- 🔐 Encryption Status - Whether backups are encrypted
- 📈 Backup History - Recent backup activity
Step 8: Understanding Backup Storage
Borgmatic stores your backups in a special location:
Backup Location
Your backups are stored in:
/opt/speedbits-backup/borgmatic-repo/- Main backup repository- This contains all your encrypted, compressed backups
- Each backup is stored as an "archive" with a timestamp
Backup Structure
Your backup repository contains:
- 📁 File Archives -
speedbits-files-server-2024-01-15-020000 - 📁 Database Archives -
speedbits-databases-server-2024-01-15-060000 - 🔐 Encryption Keys - Secure keys for accessing backups
- 📊 Metadata - Information about each backup
Step 9: Test Your First Backup
Let's run a test backup to make sure everything works:
Manual Backup Test
In the Infinity Tools menu, go to:
- 💾 BACKUP MANAGEMENT → Run Manual Backup
This will start a backup immediately and show you the progress.
What You'll See
During the backup, you'll see messages like:
Starting SpeedBits file backup...
Creating archive speedbits-files-server-2024-01-15-143000...
Backing up /opt/speedbits/vaultwarden...
Backing up /opt/speedbits/traefik...
File backup completed successfully
Understanding Backup Progress
The backup process shows:
- 📁 Files being backed up - What's currently being processed
- 📊 Progress indicators - How much is complete
- ⏱️ Time estimates - How long it will take
- ✅ Completion status - When it's finished
What's Next?
Congratulations! You now have an automated backup system protecting all your data.
What You've Accomplished
- ✅ Installed Borgmatic - Automated backup system
- ✅ Configured encryption - Your backups are secure
- ✅ Set up schedules - Backups run automatically
- ✅ Enabled monitoring - You'll know if something goes wrong
- ✅ Protected your data - Everything is safely backed up
Next Steps
Now you can:
- Install more applications - They'll be automatically backed up
- Monitor backup status - Check that backups are running
- Test recovery - Practice restoring files when needed
- Set up notifications - Get alerts about backup status
Troubleshooting
Backup Not Running
If backups aren't running:
- Check that Borgmatic container is running:
docker ps | grep borgmatic - Check backup logs:
docker logs borgmatic - Verify there's enough disk space
- Check that applications are installed to backup
Backup Fails
If backups fail:
- Check disk space - Backups need free space
- Verify passphrase is correct
- Check file permissions
- Look at error messages in the logs
Can't Access Backups
If you can't access your backups:
- Make sure you have the correct passphrase
- Check that the backup repository exists
- Verify file permissions on backup directory
- Try running a manual backup to test
Quick Reference
Check Borgmatic status:
docker ps | grep borgmaticView backup logs:
docker logs borgmaticRun manual backup:
docker exec borgmatic borgmatic --config /etc/borgmatic/borgmatic-files.yml createList all backups:
docker exec borgmatic borg list /backups/borgmatic-repoYou're Ready!
Borgmatic is now installed and protecting your data! You have a professional-grade backup system that runs automatically and keeps your data safe.
What you accomplished:
- ✅ Installed and configured Borgmatic
- ✅ Set up encrypted, automated backups
- ✅ Protected all your applications and data
- ✅ Enabled monitoring and notifications
Next step: You can now install your first application (Vaultwarden) knowing it will be automatically backed up and protected!
What You Learned
- Borgmatic - An automated backup system for data protection
- Backup Strategies - How to protect files and databases
- Encryption - How to keep backups secure
- Automation - How to set up hands-off data protection
- Monitoring - How to ensure backups are working
You now have enterprise-grade data protection running on your server!
Next: Installing Vaultwarden - Your Password Manager (Chapter 7)
7: Portainer – Docker Management Made Easy (optional but convenient)
Portainer gives you a friendly web interface to manage your Docker containers, images, volumes, and networks. Instead of typing commands in the terminal, you can click buttons and see everything visually. Think of it as a control panel for all your Docker applications.
For advanced features, team management, and detailed documentation, see the official Portainer documentation.
Why Portainer?
- ✅ Visual management - See all your containers at a glance
- ✅ Easy operations - Start, stop, restart containers with clicks
- ✅ View logs - See what's happening inside containers
- ✅ Deploy stacks - Install applications using docker-compose files via web UI
- ✅ Monitor resources - See CPU, memory, and network usage
- ✅ No terminal needed - Manage everything from your browser
Prerequisites
- ✅ Docker running (from Chapter 3)
- ✅ Optional: Traefik installed (from Chapter 4) for HTTPS access with a domain
- ✅ Optional: Subdomain (from Chapter 4.5), e.g.,
portainer.yourdomain.com
Note: Portainer works fine without Traefik - you can access it directly via IP address and port. Traefik just makes it more secure and easier to access with a friendly domain name.
Step 1: Start Infinity Tools
sudo infinity-toolsStep 2: Install Portainer
- Go to 📱 APPLICATIONS
- Select Portainer
- Choose Install Portainer
Using the Infinity Tools GUI
- Use ↑/↓ to move, Enter to select, Esc to go back
- Look for the turquoise cursor indicating the current selection
- Each screen shows a short description at the top explaining what's needed
Step 2.1: Choose SSL Mode
You'll see two options. Here's what each means:
- Traefik (recommended)
- What it is: Uses your domain name with a trusted HTTPS certificate from Let's Encrypt
- What you need: A subdomain (e.g.,
portainer.yourdomain.com) pointing to your server (see Chapter 4.5) - What you get: No browser warnings, a clean URL like
https://portainer.yourdomain.com - Pick this if: You want secure, easy access with a domain name
- Standalone HTTPS (self-signed)
- What it is: Uses HTTPS with a self-signed certificate (your browser will warn it's not trusted)
- What you need: Just a free port (default: 9443)
- What you get: URL like
https://SERVER_IP:9443with a warning you must accept once - Pick this if: You don't have a domain yet or only use Portainer on your local network
Simple rule of thumb: Use Traefik if you have a domain and want the best experience; use Standalone HTTPS if you're just getting started or don't have a domain yet.
Step 2.2: If You Choose Traefik
- Enter your subdomain, e.g.,
portainer.yourdomain.com - Ensure the subdomain's DNS A record points to your server (see Chapter 4.5)
- Infinity Tools will configure HTTPS automatically via Let's Encrypt
After install: Your Portainer will be available at https://portainer.yourdomain.com
Step 2.3: If You Choose Standalone
- Pick a port (default: 9443)
- Your Portainer will be available at
https://SERVER_IP:9443 - When you first visit, accept the browser security warning (click "Advanced" → "Proceed")
What Happens During Installation
- Portainer container is created
- Data directory is set up at
/opt/speedbits/portainer - Optional domain + Traefik HTTPS routing (if using Traefik)
- Service starts and becomes accessible
Step 3: First-Time Setup (IMPORTANT!)
⚠️ CRITICAL: Portainer requires you to create admin credentials on your FIRST login. There is no default password!
Step 3.1: Open Portainer
- Open the access URL shown after installation in your browser
- If using Traefik: Wait 30-60 seconds for SSL certificate generation
- If using Standalone: Accept the browser security warning
Step 3.2: Create Admin Account
You'll see a screen: "Create the first administrator user"
- Username: Choose any username (many people use "admin")
- Password: Enter a STRONG password (minimum 12 characters)
- 💡 Tip: Use a password manager (like Vaultwarden from Chapter 7!) to generate and store a strong password (20+ characters)
- Click "Create user"
⚠️ WRITE DOWN YOUR CREDENTIALS IMMEDIATELY!
This is your ONLY chance to set the initial password. There is NO "forgot password" option on first setup. If you forget it, you'll need to reset Portainer completely (see Troubleshooting below).
Step 3.3: Connect to Docker
- After creating your account, you'll see: "Get Started"
- Click "Get Started"
- Select "Docker" environment
- Click "Connect"
✅ Done! You'll immediately see all your Docker containers, images, volumes, and networks.
What You Can Do in Portainer
Container Management
- 📦 View all containers - See running, stopped, and all containers
- ▶️ Start/Stop/Restart - Control containers with buttons
- 📋 View logs - See what's happening inside containers in real-time
- ⚙️ Inspect settings - See environment variables, volumes, networks
- 💻 Execute commands - Run commands inside containers (like opening a terminal)
Image Management
- 🖼️ Browse images - See all Docker images on your server
- 🗑️ Remove unused images - Free up disk space
- 📥 Pull new images - Download images from Docker Hub
Stack Deployment
- 🚀 Deploy stacks - Install applications using docker-compose files via web UI
- 📝 Edit stacks - Modify docker-compose configurations visually
- 🔄 Update stacks - Update applications with new configurations
Monitoring
- 📊 Resource usage - See CPU, memory, and network usage for each container
- 📈 Statistics - View historical performance data
- 🔍 Health checks - See container health status
Volume and Network Management
- 💾 Manage volumes - View, create, and delete data volumes
- 🌐 Manage networks - View and configure Docker networks
Security Recommendations
Portainer has FULL access to your Docker system, so it's important to protect it:
- ✅ Use a strong password - Minimum 12 characters, preferably 20+
- ✅ Store credentials securely - Use a password manager (Vaultwarden recommended!)
- ✅ Enable 2FA - Go to Settings → Users → Two-Factor Authentication (after first login)
- ✅ Create separate users - If sharing access, create individual accounts (don't share admin)
- ✅ Regular backups - Go to Settings → Backup Configuration to export your Portainer settings
- ⚠️ Protect access - Portainer can control all your containers - keep it secure!
Troubleshooting
Forgot Your Password?
If you forgot your Portainer admin password, you'll need to reset it completely:
- Stop Portainer:
cd /opt/speedbits/portainer docker compose down - Delete the Portainer database:
rm -rf /opt/speedbits/portainer/data - Restart Portainer:
cd /opt/speedbits/portainer docker compose up -d - Open Portainer again and create a new admin account
⚠️ WARNING: This deletes ALL Portainer settings (users, preferences, etc.), but your Docker containers are NOT affected.
Can't Access Portainer
- Traefik mode: Wait 30-60 seconds after installation for SSL certificate generation
- Standalone mode: Make sure you're using
https://(nothttp://) - Check container status: Run
docker ps | grep portainerto see if it's running - Check logs: Run
docker logs portainerto see error messages
Portainer Shows No Containers
- Make sure you selected "Docker" environment during first-time setup
- Check that Docker is running:
docker ps - Refresh the Portainer page
Where to Find Portainer After Install
- On the finish screen, Infinity Tools prints the access URL
- You can also see it in 📊 STATUS & HEALTH → STATUS
- Check the installation directory:
/opt/speedbits/portainer
You're Ready!
Portainer is now installed and ready to use. You can manage all your Docker containers visually from your browser. This makes it much easier to work with your Infinity Tools applications!
Next steps: Use Portainer to monitor your containers, view logs, and manage your Docker environment. You can continue installing other Infinity Tools applications - Portainer will help you keep track of everything.
Apps
These are the productivity apps in Infinity Tools. Note that unlike in the previous chapter, there is no specific order to these apps. You can choose what you need. The chapter numbers are only for organizational purposes.
8: Vaultwarden - Password Manager
Vaultwarden is a self-hosted password manager that lets you store and manage all your passwords securely on your own server. It's compatible with all Bitwarden apps, so you can use it with your phone, computer, and web browser. For comprehensive usage instructions and advanced features, please refer to the official Vaultwarden documentation.
What is Vaultwarden?
Vaultwarden is like a digital safe for all your passwords. Instead of remembering dozens of different passwords, you only need to remember one master password to access all your accounts.
Why Vaultwarden is useful:
- ✅ Store passwords securely - All passwords are encrypted and safe
- ✅ Generate strong passwords - Creates secure passwords for you
- ✅ Works everywhere - Phone, computer, web browser
- ✅ Sync across devices - Your passwords are available everywhere
- ✅ You own your data - Everything stays on your server
Think of it like this: Instead of writing passwords on sticky notes or using the same password everywhere, Vaultwarden keeps them all safe in one encrypted vault that only you can access.
Prerequisites
Before installing Vaultwarden, make sure you have:
- ✅ Traefik installed (from Chapter 4)
- ✅ Docker running (from Chapter 3)
- ✅ A domain name (recommended for security)
- ✅ An email address (for SSL certificates)
Why These Prerequisites Matter
Traefik: Provides secure HTTPS access to your password manager
Docker: Runs Vaultwarden in a secure container
Domain name: Makes it easier to access and more secure
Email: Required for SSL certificates to keep your passwords safe
Step 1: Start Infinity Tools
Make sure you're connected to your server via SSH, then start Infinity Tools:
sudo infinity-toolsUsing the Infinity Tools GUI
When you start Infinity Tools, you'll see the main menu. Look for the 📱 APPLICATIONS section - this is where all your apps are located.
- ✅ Color-coded sections - Applications have their own section
- ✅ Clear descriptions - Each app shows what it does
- ✅ Status indicators - Shows if apps are installed or running
- ✅ Easy navigation - Use arrow keys to move around
Step 2: Navigate to Vaultwarden
In the Infinity Tools menu:
- Use your arrow keys to navigate to 📱 APPLICATIONS
- Press Enter to open the Applications menu
- Look for Vaultwarden in the list
- Select it and press Enter
Understanding the Application Menu
The Applications section shows you all available apps:
- 🔐 Security Apps - Vaultwarden, WireGuard, Warpgate
- ☁️ Cloud Apps - Nextcloud, Syncthing
- 🌐 Web Apps - WordPress, Matomo
- 📊 Monitoring Apps - Netdata, Uptime Kuma
Look for the turquoise cursor - it shows what you're about to select!
Step 3: Install Vaultwarden
When you select Vaultwarden, you'll see installation options. Choose Install Vaultwarden.
What Happens During Installation
Vaultwarden installation will:
- Create a secure container for your password data
- Set up SSL certificates for secure access
- Configure the web interface
- Generate an admin token for management
- Start the service
This usually takes 2-3 minutes.
Step 4: Configure Vaultwarden
During installation, you'll be asked several questions:
SSL Configuration
You'll see a prompt like:
🌐 SSL Certificate Configuration
===============================
Do you want to use Traefik for SSL certificates and domain routing?

Y) Yes (default) - Use Traefik with Let's Encrypt SSL and domain
N) No - Standalone with self-signed certificate and direct port access
Choose "Y" (Yes) - This uses Traefik for secure HTTPS access (recommended).
Domain Configuration
You'll be asked for your domain name:
Enter the domain name for Vaultwarden:
[vault.example.com]
What to enter: Use a subdomain like vault.yourdomain.com or passwords.yourdomain.com
Examples:
vault.myinfinitytools.compasswords.mydomain.comvault.home.local(for local testing)
User Signup Policy
You'll be asked about user signups:
👥 User Signup Policy
==================
Do you want to allow new users to sign up?

Y) Yes - Allow anyone to create an account
N) No - Only admin can create accounts (recommended)
For beginners: Choose "N" (No) - This keeps your password manager private and secure.
Step 5: Wait for Installation
After answering the questions, Vaultwarden will install and start. You'll see messages like:
📦 Installing Vaultwarden...
🔧 Creating configuration...
🌐 Setting up SSL certificates...
🔐 Generating admin token...
✅ Vaultwarden installed successfully!
Step 6: Get Your Admin Token
After installation, you'll see important information:
🔐 Vaultwarden Admin Information
===============================

Admin Token: abc123def456ghi789...
Web Vault: https://vault.yourdomain.com
Admin Panel: https://vault.yourdomain.com/admin
Save Your Admin Token
IMPORTANT: Save your admin token in a safe place! You'll need it to:
- Access the admin panel
- Manage users and settings
- Configure advanced options
How to save it:
- Copy it to a secure note on your phone
- Write it down and store it safely
- Don't share it with anyone
Step 7: Verify Vaultwarden is Working
Let's make sure Vaultwarden is running properly.
Check Status in Infinity Tools
In the Infinity Tools menu, go to:
- 📊 STATUS & HEALTH → STATUS
You should see Vaultwarden listed as "RUNNING" or "ACTIVE".
Using the Status Dashboard
The Status & Health section shows you:
- ✅ Service Status - Which applications are running
- ✅ System Health - CPU, memory, and disk usage
- ✅ Docker Info - All your containers and their status
- ✅ Network Status - Shows your Docker networks
Look for the green checkmarks - they indicate everything is working properly!
Test Your Web Vault
Open your web browser and visit your Vaultwarden URL:
- Go to
https://vault.yourdomain.com - You should see the Vaultwarden login page
- Look for the lock icon in your browser (secure connection)
Step 8: Create Your First Account
Now it's time to set up your password manager!
Sign Up Process
- Visit your Vaultwarden URL in your browser
- Click "Create Account"
- Enter your email address
- Create a strong master password
- Confirm your password
- Click "Create Account"
Choosing a Strong Master Password
Your master password protects all your other passwords. Make it:
- ✅ At least 12 characters long
- ✅ Mix of letters, numbers, and symbols
- ✅ Easy for you to remember
- ✅ Unique (don't use it anywhere else)
Example: MyDog@2024!Loves#Treats
Step 9: Understanding What Was Created
Vaultwarden installation creates several important files and configurations:
Data Storage
Your password data is stored in:
/opt/speedbits/vaultwarden/data/- Your encrypted password database/opt/speedbits/vaultwarden/admin_token.txt- Your admin access token
Web Access
Vaultwarden provides:
- Web Vault:
https://vault.yourdomain.com- Main interface - Admin Panel:
https://vault.yourdomain.com/admin- Management interface
Security Features
Vaultwarden includes:
- ✅ End-to-end encryption - Your passwords are encrypted
- ✅ HTTPS access - Secure connection
- ✅ Admin controls - Manage users and settings
- ✅ Backup ready - Data can be backed up easily
What's Next?
Congratulations! You now have your own password manager running securely on your server.
Next Steps
- ✅ Download Bitwarden apps - For your phone and computer
- ✅ Import existing passwords - From other password managers
- ✅ Set up two-factor authentication - For extra security
- ✅ Create your first password - Start using your vault
Getting Help
For detailed usage instructions, advanced features, and troubleshooting, please refer to the official Vaultwarden documentation.
Troubleshooting
Can't Access Vaultwarden
If you can't access your Vaultwarden:
- Check that Traefik is running:
docker ps | grep traefik - Verify your domain points to your server
- Wait a few minutes for SSL certificates to be issued
- Check Vaultwarden logs:
docker logs vaultwarden
SSL Certificate Issues
If you see security warnings:
- Make sure your domain is correctly configured
- Check that ports 80 and 443 are open
- Wait for certificates to be generated (can take 5-10 minutes)
- Try refreshing the page after a few minutes
Can't Create Account
If signup is disabled:
- Use the admin panel to create accounts
- Go to
https://vault.yourdomain.com/admin - Use your admin token to log in
- Create user accounts from the admin interface
Quick Reference
Check Vaultwarden status:
docker ps | grep vaultwardenView Vaultwarden logs:
docker logs vaultwardenRestart Vaultwarden:
docker restart vaultwardenAccess admin panel:
https://vault.yourdomain.com/adminYou're Ready!
Vaultwarden is now installed and running! You have your own secure password manager that you control completely.
What you accomplished:
- ✅ Installed and configured Vaultwarden
- ✅ Set up secure HTTPS access
- ✅ Created your admin account
- ✅ Secured your password data
Next step: Download the Bitwarden apps for your devices and start using your new password manager!
What You Learned
- Vaultwarden - A self-hosted password manager
- Password Security - How to store passwords safely
- Admin Management - How to control access to your vault
- SSL Security - How HTTPS protects your data
You now have a professional-grade password manager running on your own server!
Next: Installing Your Next Application (Coming Soon)
9: Passbolt - Team Password Manager
Passbolt is a team-oriented, self-hosted password manager built on OpenPGP. It lets you securely store and share passwords with your team. For comprehensive usage instructions, browser extension setup, and advanced features, please refer to the official Passbolt documentation.
What is Passbolt? (Simple Explanation)
Passbolt helps teams store and share passwords securely. It uses strong encryption and a browser extension to keep your secrets safe and easy to use.
Why Passbolt is useful:
- ✅ Team sharing - Share secrets with specific people
- ✅ Strong security - OpenPGP-based encryption
- ✅ Browser extensions - Easy access in Chrome/Firefox
- ✅ Self-hosted - You control your data
Prerequisites
Before installing Passbolt, make sure you have:
- ✅ Traefik installed (from Chapter 4)
- ✅ Docker running (from Chapter 3)
- ✅ Borgmatic installed (from Chapter 5) - Your data will be automatically backed up (optional but recommended)
- ✅ Subdomain ready (from Chapter 4.5), e.g.,
pass.yourdomain.com - ✅ An email address (for SSL certificates)
Why These Prerequisites Matter
Traefik: Provides secure HTTPS access
Docker: Runs Passbolt securely in containers
Borgmatic: Automatically backs up your Passbolt data and database
Subdomain: Easy, secure access for your team
Step 1: Start Infinity Tools
Connect via SSH and start Infinity Tools:
sudo infinity-toolsUsing the Infinity Tools GUI
- ✅ Clear categories - Applications are grouped logically
- ✅ Status indicators - Shows if services are installed
- ✅ Easy navigation - Arrow keys + Enter
Step 2: Install Passbolt
- Open 📱 APPLICATIONS
- Select Passbolt
- Choose Install Passbolt
What Happens During Installation
- Creates Passbolt and database containers
- Generates secure database passwords
- Configures SSL via Traefik (recommended)
- Sets up data directories in
/opt/speedbits/passbolt
Step 3: Configure Passbolt
SSL & Domain
You'll be asked whether to use Traefik and for your domain. Recommended:
- Use Traefik: Yes
- Domain: e.g.,
pass.yourdomain.com
Admin Account
After installation, you'll finish setup in the browser by creating the first admin user and installing the Passbolt browser extension.
Step 4: Open Passbolt
Once installation completes:
- Go to
https://pass.yourdomain.com - Follow the on-screen setup wizard
- Install the Passbolt browser extension when prompted
Step 5: Verify and Basics
- ✅ Service running: Check 📊 STATUS & HEALTH → STATUS
- ✅ Backup active: Borgmatic will include Passbolt data automatically
- ✅ Login works: Use your admin account
Troubleshooting
Can't Access the Site
- Check Traefik is running:
docker ps | grep traefik - Make sure your subdomain points to your server
- Wait a few minutes for SSL certificates
Database Issues
- Check database container status in 📊 STATUS & HEALTH → DOCKER INFO
- Review logs:
docker logs passbolt,docker logs passbolt-db
Quick Reference
Web UI: https://pass.yourdomain.com
Data directory: /opt/speedbits/passbolt/
Database credentials: /opt/speedbits/passbolt/db_password.txt
You're Ready!
Passbolt is now installed and ready for your team. Manage users and shared passwords from the web interface and browser extension.
Next: Add your team, create groups, and start sharing passwords securely. For how-to guides and best practices, see the official Passbolt documentation.
10: Syncthing - File Synchronization
Syncthing keeps folders on your devices in sync (PCs, servers, laptops). It’s private, fast, and peer‑to‑peer. For detailed usage and device pairing guides, see the official Syncthing documentation.
Dependency check
- Required: Docker (Chapter 3)
- Optional: Traefik (Chapter 4) + subdomain (Chapter 4.5) for easy HTTPS access
- Optional: Borgmatic (Chapter 6) to back up Syncthing data
What is Syncthing? (Simple Explanation)
Syncthing lets you pick a folder (e.g., Documents) and keep it automatically synchronized between your devices. You choose which devices and folders to sync—nothing is uploaded to third‑party clouds.
Interdependencies
Optional but recommended: Traefik for secure HTTPS access with your domain (easier to reach your server). Borgmatic will back up Syncthing data as part of your regular backups.
Prerequisites
- ✅ Docker running (Chapter 3)
- ✅ Optional: Traefik installed (Chapter 4) + subdomain (Chapter 4.5), e.g.,
sync.yourdomain.com - ✅ Optional: Borgmatic installed (Chapter 6) for backups
Step 1: Start Infinity Tools
sudo infinity-toolsStep 2: Install Syncthing
- Go to 📱 APPLICATIONS
- Select Syncthing
- Choose Install Syncthing
Using the Infinity Tools GUI
- Use ↑/↓ to move, Enter to select, Esc to go back
- Look for the turquoise cursor indicating the current selection
- Each screen shows a short description at the top explaining what’s needed
Step 2.1: Choose SSL Mode
You’ll be asked how you want to access Syncthing’s web interface:
- Traefik (recommended)
- What it is: Use your domain with a trusted HTTPS certificate
- What you need: Subdomain like
sync.yourdomain.compointing to your server - What you get: Clean URL like
https://sync.yourdomain.com - Pick this if: You want easy, secure access from anywhere
- Standalone HTTPS (self‑signed)
- What it is: HTTPS with a self‑signed certificate (browser warning appears once)
- What you need: A free port (e.g., 8384)
- What you get: URL like
https://SERVER_IP:8384 - Pick this if: You use it only within your home/office network
- Standalone HTTP (not encrypted)
- What it is: Plain HTTP
- Pick this only if: Quick local testing on a private network
Rule of thumb: Use Traefik if you have a domain. Otherwise use Standalone HTTPS for local networks.
Step 3: Open Syncthing
- Traefik mode: Visit
https://sync.yourdomain.com - Standalone: Visit
https://SERVER_IP:8384(or the port you chose)
Step 4: First‑Time Basics
- Change the GUI password: In Settings → GUI, set a username/password
- Set the device name: Give your server a friendly name (e.g., “Home‑Server”)
- Create your first folder: Click “Add Folder” → pick a folder path (e.g.,
/opt/speedbits/syncthing/Documents)
Step 5: Pair a Device
- Install Syncthing on your computer/phone (see official downloads)
- On your device, copy the Device ID (a long string)
- On the server web UI, click “Add Remote Device” → paste the Device ID → give it a name
- Accept the pairing request on the other device
- Share a folder: Select your folder → “Share With Devices” → pick the device you added
Step 6: Verify It Works
- Create a test file (e.g.,
Test.txt) in the synced folder on one device - Within seconds, the file should appear on the other device
Troubleshooting
- Can’t open the web UI? Check the URL/port and that the Syncthing container is running:
docker ps | grep syncthing - Browser warning? That’s normal for self‑signed HTTPS—accept once to proceed
- Folder not syncing? Make sure both devices shared the same folder and have write permissions
- Firewall issues? Ensure ports are open or use Traefik mode for easier access
Quick Reference
- Web UI (Traefik):
https://sync.yourdomain.com - Web UI (Standalone):
https://SERVER_IP:8384 - Change GUI password: Settings → GUI
You’re ready to keep your files in sync across devices—privately and securely.
11: Nextcloud - Private Cloud
Nextcloud is a self-hosted cloud platform for files, photos, calendars, and more — think of it like your own private Dropbox or Google Drive. For full usage instructions and advanced features, please refer to the official Nextcloud documentation.
What is Nextcloud? (Simple Explanation)
Nextcloud lets you store and share files, view photos, sync calendars and contacts, and access everything from mobile and desktop apps — all running on your own server, under your control.
Prerequisites
Before installing Nextcloud, make sure you have:
- ✅ Traefik installed (from Chapter 4) for secure HTTPS and domain routing
- ✅ Docker running (from Chapter 3)
- ✅ Apprise installed (from Chapter 5) for notifications
- ✅ Borgmatic installed (from Chapter 6) for automated backups (optional but recommended)
- ✅ A domain name (recommended) and an email address for SSL certificates
Interdependencies: Backups for Nextcloud use Borgmatic (Chapter 6). Borgmatic notifications rely on Apprise (Chapter 5). If you skip backups now, you can add them later.
Step 1: Start Infinity Tools
Connect to your server via SSH and start Infinity Tools:
sudo infinity-toolsUsing the Infinity Tools GUI
- ✅ Applications are grouped with clear descriptions
- ✅ Status indicators show if apps are installed/running
- ✅ Navigate with the arrow keys, press Enter to select
Step 2: Open Nextcloud in Applications
- Go to 📱 APPLICATIONS
- Select Nextcloud
- Choose Install Nextcloud
What the installer does
- Creates a PostgreSQL database
- Sets up the Nextcloud service
- Connects to Traefik for HTTPS (if selected)
- Prepares data folders under
/opt/speedbits/nextcloud - Generates secure admin and database passwords
Step 3: Choose HTTPS Mode
When asked about SSL/HTTPS:
Use Traefik for SSL? (Y/n)- Y (recommended): Uses your domain with automatic SSL via Traefik
- N: Standalone mode using a direct port (HTTP or self-signed HTTPS)
Step 4: Enter Your Domain (Traefik Mode)
Example domains:
cloud.yourdomain.comfiles.yourdomain.com
If you’re not using a domain, the installer will ask you to pick a port for local access.
Step 5: Set Default Storage Quota
The installer offers to set a default per-user quota.
- Recommended: Choose per-user quota (e.g., 5 GB to start)
- You can change quotas later in the web interface
- This helps prevent your server from running out of disk space
Step 6: Wait for Installation
First-time setup takes about 2–5 minutes. The installer will show progress while Nextcloud initializes.
Step 7: Save Your Admin Credentials
When installation finishes, you’ll see an admin username and password. Write them down and keep them safe.
You can also find them in /opt/speedbits/nextcloud/.env (root-only).
Step 8: Open Nextcloud
- Traefik mode: Visit
https://your-domain(e.g.,https://cloud.yourdomain.com) - Standalone mode: Visit the IP and port shown by the installer (e.g.,
http://SERVER_IP:PORT)
Step 9: Verify It’s Running
In Infinity Tools, go to 📊 STATUS & HEALTH → STATUS. You should see Nextcloud and its database running.
Step 10: Recommended Next Steps
- ✅ Set up email in Nextcloud (for password resets and notifications)
- ✅ Install useful apps: Calendar, Contacts, Notes, Deck
- ✅ Configure user quotas (Settings → Users)
- ✅ Enable backups with Borgmatic (Chapter 6)
- ✅ Install mobile apps (iOS/Android) and desktop sync client
Troubleshooting
Can’t access the site
- Check that Traefik is running:
docker ps | grep traefik - Verify your domain points to your server (DNS)
- Wait a few minutes for SSL certificates to be issued
- Check Nextcloud logs:
docker logs nextcloud
Running out of disk space
- Reduce user quotas or free storage
- Monitor usage:
df -h /opt/speedbits/nextcloud
SSL warning in standalone HTTPS
Self-signed certificates show a browser warning. Click “Advanced → Proceed” to continue, or switch to Traefik with a real domain for trusted HTTPS.
Quick Reference
Check containers:
docker ps | grep -E "nextcloud|nextcloud-db"View logs:
docker logs nextcloudRestart service:
cd /opt/speedbits/nextcloud && docker compose restartHelpful Resources
12: WordPress - Build Your Website
WordPress is the most popular platform for building websites and blogs. With Infinity Tools, you can install WordPress securely on your own server with just a few steps. For everything beyond installation and basic usage, see the official WordPress documentation.
What is WordPress? (Simple Explanation)
WordPress lets you create a website or blog using themes and plugins — no coding required. You manage posts, pages, and media from a friendly dashboard, and extend features with plugins (contact forms, SEO, e‑commerce, and more).
- ✅ Easy to use dashboard for content
- ✅ Thousands of themes to change the look
- ✅ Plugins for features like forms, SEO, shops
- ✅ You own it — runs on your server
Prerequisites
Before installing WordPress, make sure you have:
- ✅ Traefik installed (from Chapter 4) for HTTPS and domains
- ✅ Docker running (from Chapter 3)
- ✅ Apprise installed (from Chapter 5) for notifications
- ✅ Borgmatic installed (from Chapter 6) for automated backups (optional but recommended)
- ✅ A domain name (recommended) and email for SSL certificates
Interdependencies: WordPress uses a database (MariaDB). Database backups integrate with Borgmatic (Chapter 6), and Borgmatic notifications rely on Apprise (Chapter 5).
Step 1: Start Infinity Tools
Connect to your server via SSH and start Infinity Tools:
sudo infinity-toolsOpen Applications
- Go to 📱 APPLICATIONS
- Select WordPress
- Choose Install WordPress
Step 2: Choose HTTPS Mode
When prompted:
Use Traefik for SSL? (Y/n)- Y (recommended): Uses your domain and automatic SSL via Traefik
- N: Standalone mode using a direct port (HTTP or self‑signed HTTPS)
Step 3: Enter Your Domain (Traefik Mode)
Examples:
myblog.yourdomain.comwww.yourdomain.com(will redirect to the main domain)
No domain? Pick a port when asked (for local access only).
Step 4: Optional Redis Cache
You can enable a performance cache called Redis. If you enable it during installation, Infinity Tools sets up a Redis container for you.
Recommended free plugin
Install the free plugin Redis Object Cache to speed up WordPress:
- From your dashboard: Plugins → Add New
- Search for Redis Object Cache by Till Krüss
- Click Install, then Activate
- Go to Settings → Redis and click Enable Object Cache
Redis Object Cache plugin (wordpress.org)
Step 5: Wait for Installation
Setup usually takes a few minutes. WordPress, the database, and (optionally) Redis will be created.
Step 6: Open Your Site
- Traefik mode: Visit
https://your-domain - Standalone mode: Visit the IP and port shown by the installer (e.g.,
http://SERVER_IP:PORT)
Complete the WordPress setup wizard and create your admin account.
Step 7: Verify It’s Running
In Infinity Tools, go to 📊 STATUS & HEALTH → STATUS. You should see WordPress, the database, and (if used) Redis running.
Recommended Next Steps
- ✅ Choose a theme that fits your site
- ✅ Install key plugins (SEO, forms, security)
- ✅ Enable Redis Object Cache if you set up Redis
- ✅ Backups: confirm Borgmatic includes WordPress data
Where Your Data Lives
/opt/speedbits/wordpress/wp_data/— WordPress files/opt/speedbits/wordpress/db_data/— Database files (MariaDB)/opt/speedbits/wordpress/redis_data/— Redis data (if enabled)
Troubleshooting
Can’t access the site
- Check Traefik is running:
docker ps | grep traefik - Verify your domain points to your server (DNS)
- Wait a few minutes for SSL certificates
- View logs:
docker logs wordpress
Database connection error
- Check database container:
docker ps | grep wp-db - Confirm password file:
/opt/speedbits/wordpress/db_password.txt - Restart:
cd /opt/speedbits/wordpress && docker compose restart
Enable HTTPS in standalone mode
Standalone HTTPS uses a self‑signed certificate and may show a browser warning. Click “Advanced → Proceed”, or switch to Traefik for trusted HTTPS.
Quick Reference
Check containers:
docker ps | grep -E "wordpress|wp-db|redis"View logs:
docker logs wordpressRestart services:
cd /opt/speedbits/wordpress && docker compose restartHelpful Resources
13: Matomo - Privacy‑Friendly Analytics
Matomo is a self‑hosted web analytics platform (an alternative to Google Analytics) that lets you track website visits while keeping full control of your data. For detailed usage and advanced features, please refer to the official Matomo documentation.
What is Matomo? (Simple Explanation)
Matomo shows you how people use your website: how many visitors you have, what pages they view, where they come from, and more — all without sending data to third parties.
- ✅ Privacy‑friendly and GDPR‑compliant
- ✅ Real‑time stats and easy dashboards
- ✅ Full control — runs on your own server
- ✅ Unlimited sites can be tracked
Prerequisites
Before installing Matomo, make sure you have:
- ✅ Traefik installed (from Chapter 4) for HTTPS and domains
- ✅ Docker running (from Chapter 3)
- ✅ Apprise installed (from Chapter 5) for notifications
- ✅ Borgmatic installed (from Chapter 6) for automated backups
- ✅ A domain name (recommended) and email for SSL certificates
Interdependencies: Matomo uses a MariaDB database. Database backups are handled by Borgmatic (Chapter 6). Borgmatic notifications rely on Apprise (Chapter 5).
Step 1: Start Infinity Tools
Connect to your server via SSH and start Infinity Tools:
sudo infinity-toolsOpen Applications
- Go to 📱 APPLICATIONS
- Select Matomo
- Choose Install Matomo
Step 2: Choose HTTPS Mode
When prompted:
Use Traefik for SSL? (Y/n)- Y (recommended): Uses your domain and automatic SSL via Traefik
- N: Standalone mode using a direct port (HTTP or self‑signed HTTPS)
Step 3: Enter Your Domain (Traefik Mode)
Examples:
analytics.yourdomain.comstats.yourdomain.com
No domain? The installer will ask you to pick a port for local access.
Step 4: Wait for Installation
First‑time setup takes a few minutes. Matomo and its database will be created and started.
Step 5: Open Matomo and Complete the Wizard
- Traefik mode: Visit
https://your-domain - Standalone mode: Visit the IP and port shown by the installer (e.g.,
http://SERVER_IP:PORTorhttps://SERVER_IP:PORT)
Follow the Matomo setup wizard:
- System check → Next
- Database setup → The installer shows your database credentials
- Create your admin account
- Add your first website to track
- Copy the tracking code (you’ll paste it into your website later)
Step 6: Verify It’s Running
In Infinity Tools, go to 📊 STATUS & HEALTH → STATUS. You should see Matomo and its database running.
Recommended Next Steps
- ✅ Add the tracking code to your website (before
</head>) - ✅ Set up the Matomo cron for reports and archiving (see below)
- ✅ Confirm backups include Matomo’s database
- ✅ Review privacy settings (IP anonymization, Do Not Track)
Cron for Archiving (Recommended)
Add this to your server’s crontab to keep reports up‑to‑date:
*/5 * * * * docker exec matomo /usr/local/bin/php /var/www/html/console core:archive >/dev/null 2>&1Troubleshooting
Can’t access the site
- Check Traefik is running:
docker ps | grep traefik - Verify your domain points to your server (DNS)
- Wait a few minutes for SSL certificates
- View logs:
docker logs matomo
Database connection error
- Check database container:
docker ps | grep matomo-db - Use the database credentials shown during installation
- Restart:
cd /opt/speedbits/matomo && docker compose restart
Quick Reference
Check containers:
docker ps | grep -E "matomo|matomo-db"View logs:
docker logs matomoRestart services:
cd /opt/speedbits/matomo && docker compose restartHelpful Resources
14: Webmin - Visual Server Management
Webmin is a web-based interface for managing your Linux server. Instead of using the command line, you can manage users, services, files, system settings, and more through a friendly web browser interface. Think of it as a control panel for your entire server.
For advanced features, module documentation, and detailed guides, see the official Webmin documentation.
Why Webmin?
- ✅ Visual server management - Manage your server without command line
- ✅ User management - Create, edit, and manage user accounts visually
- ✅ File browser - Browse and edit files with a web interface
- ✅ Service management - Start, stop, and configure system services
- ✅ System monitoring - View system resources and logs
- ✅ Package management - Install and update software packages
- ✅ Network configuration - Configure network settings
Prerequisites
- ✅ Docker running (from Chapter 3)
- ✅ Optional: Traefik installed (from Chapter 4) for HTTPS access with a domain
- ✅ Optional: Subdomain (from Chapter 4.5), e.g.,
webmin.yourdomain.com
Note: Webmin is typically accessed via SSH tunnel for security. The installation script will guide you through this. Traefik mode is optional and allows direct web access.
Step 1: Start Infinity Tools
sudo infinity-toolsStep 2: Install Webmin
- Go to 📱 APPLICATIONS
- Select Webmin
- Choose Install Webmin
Using the Infinity Tools GUI
- Use ↑/↓ to move, Enter to select, Esc to go back
- Look for the turquoise cursor indicating the current selection
- Each screen shows a short description at the top explaining what's needed
Step 2.1: Choose SSL Mode
You'll see two options. Here's what each means:
- Traefik (optional)
- What it is: Uses your domain name with a trusted HTTPS certificate from Let's Encrypt
- What you need: A subdomain (e.g.,
webmin.yourdomain.com) pointing to your server (see Chapter 4.5) - What you get: Direct web access at
https://webmin.yourdomain.com - Pick this if: You want direct web access without SSH tunneling
- Standalone (recommended)
- What it is: Uses HTTPS with a self-signed certificate, accessed via SSH tunnel
- What you need: SSH access to your server
- What you get: Secure access via SSH tunnel (more secure than direct web access)
- Pick this if: You want the most secure setup (recommended)
Simple rule of thumb: Use Standalone for security (SSH tunnel), or Traefik if you want direct web access.
Step 2.2: If You Choose Traefik
- Enter your subdomain, e.g.,
webmin.yourdomain.com - Ensure the subdomain's DNS A record points to your server (see Chapter 4.5)
- Infinity Tools will configure HTTPS automatically via Let's Encrypt
After install: Your Webmin will be available at https://webmin.yourdomain.com
Step 2.3: If You Choose Standalone
- Pick a port (default: 8443)
- You'll access Webmin via SSH tunnel (instructions shown after installation)
Step 2.4: Host Filesystem Access
You'll be asked about host filesystem access. This controls whether Webmin can browse files on your actual server (not just inside the container).
- No (default)
- What it is: Webmin can only browse files inside its own container
- Pick this if: You want maximum security and only need Webmin for system management (not file browsing)
- Yes (Read-Only)
- What it is: Webmin can browse host files at
/host/but cannot edit them - Pick this if: You want to view server files safely without risk of accidental changes
- What it is: Webmin can browse host files at
- Yes (Read-Write)
- What it is: Webmin can browse AND edit host files at
/host/ - Pick this if: You want full file management capabilities
- ⚠️ Warning: This gives Webmin full access to your server's filesystem - use with caution!
- What it is: Webmin can browse AND edit host files at
What Happens During Installation
- Webmin container is created
- System user
webminadminis created with a random password - Data directory is set up at
/opt/speedbits/webmin - Optional domain + Traefik HTTPS routing (if using Traefik)
- Service starts and becomes accessible
Step 3: Access Webmin
If Using Traefik
- Wait 30-60 seconds for SSL certificate generation
- Open
https://webmin.yourdomain.comin your browser - Login with the credentials shown after installation
If Using Standalone (SSH Tunnel)
⚠️ IMPORTANT: Webmin requires an SSH tunnel for secure access. You cannot access it directly from the internet.
On your local computer (not the server), run:
ssh -L 8443:localhost:10000 your-username@your-server-ipReplace:
your-username- Your SSH usernameyour-server-ip- Your server's IP address8443- The port you chose during installation (or default 8443)
Then in your browser, open:
https://localhost:8443You'll see a security warning (normal for self-signed certificates). Click "Advanced" → "Proceed" to continue.
Step 4: Login to Webmin
After installation, you'll see credentials like:
- Username:
webminadmin - Password: A randomly generated password (shown only once!)
⚠️ CRITICAL: Write down or save this password immediately! It will NOT be shown again. Use a password manager (like Vaultwarden from Chapter 7) to store it securely.
Login Steps
- Enter username:
webminadmin - Enter the password shown after installation
- Click "Login"
Note: Any user with sudo privileges can also login to Webmin using their system username and password.
Step 5: Understanding the File Manager
⭐ IMPORTANT: When you first open Webmin's File Manager, you're browsing files inside the Webmin container, not your actual server!
How to Access Host System Files
To browse files on your actual server (the host system), you need to navigate to the /host/ folder:
- Go to Other → File Manager in Webmin
- You'll see the container's filesystem (usually empty or minimal)
- To access host files: Type
/host/in the path bar at the top - Press Enter or click "Go"
- Now you'll see your actual server's filesystem!
Understanding the Path Structure
- Container files:
/(root of container) - Host files:
/host/(mounted host filesystem)
Examples
- Host home directories: Navigate to
/host/home/ - Host system logs: Navigate to
/host/var/log/ - Host Docker data: Navigate to
/host/opt/ - Host Infinity Tools: Navigate to
/host/opt/InfinityTools/ - Host Speedbits data: Navigate to
/host/opt/speedbits/
💡 Tip: Bookmark /host/ or add it to your favorites in Webmin for quick access!
File Access Modes
Depending on what you chose during installation:
- Read-Only: You can view files at
/host/but cannot edit or delete them - Read-Write: You can view, edit, create, and delete files at
/host/ - No Access: The
/host/folder won't exist - you can only browse container files
What You Can Do in Webmin
System Management
- 👥 User Management - Create, edit, delete user accounts
- 🔐 Password Management - Change user passwords
- ⚙️ Service Management - Start, stop, restart system services
- 📦 Package Management - Install and update software
File Management
- 📁 File Browser - Browse and edit files (remember to use
/host/for host files!) - 📝 Text Editor - Edit configuration files
- 📤 File Upload/Download - Transfer files to/from server
Monitoring
- 📊 System Information - View CPU, memory, disk usage
- 📋 Log Viewer - View system logs
- 🌐 Network Configuration - Configure network settings
Security Recommendations
- ✅ Use SSH tunnel - Standalone mode with SSH tunnel is more secure than direct web access
- ✅ Strong password - The generated password is strong, but you can change it in Webmin
- ✅ Store credentials securely - Use a password manager (Vaultwarden recommended!)
- ✅ Limit filesystem access - Use "Read-Only" unless you need to edit files
- ✅ Regular updates - Keep Webmin updated for security patches
- ⚠️ Protect access - Webmin has powerful system management capabilities - keep it secure!
Troubleshooting
Can't Access Webmin
- Traefik mode: Wait 30-60 seconds after installation for SSL certificate generation
- Standalone mode: Make sure you're using SSH tunnel (not direct access)
- Check container status: Run
docker ps | grep webminto see if it's running - Check logs: Run
docker logs webminto see error messages
Can't Login
- Make sure you're using the correct username:
webminadmin - Check that you saved the password correctly (it's shown only once!)
- Try logging in with a system user that has sudo privileges
- Check if user exists:
docker exec webmin grep webminadmin /etc/passwd
Can't See Host Files
- Remember: You must navigate to
/host/in the File Manager path bar - If
/host/doesn't exist, you chose "No" for host filesystem access during installation - To enable it, reinstall Webmin and choose "Yes (Read-Only)" or "Yes (Read-Write)"
- Check installation: Look for
/hostin the docker-compose.yml file
SSH Tunnel Not Working
- Make sure SSH is working:
ssh your-username@your-server-ip - Check the port number matches what you chose during installation
- Try using the container IP directly:
ssh -L 8443:CONTAINER_IP:10000 user@server - Check Webmin is running:
docker ps | grep webmin
Where to Find Webmin After Install
- On the finish screen, Infinity Tools prints the access URL and SSH tunnel command
- You can also see it in 📊 STATUS & HEALTH → STATUS
- Check the installation directory:
/opt/speedbits/webmin - View credentials: The password is shown only once during installation - save it!
You're Ready!
Webmin is now installed and ready to use. You can manage your Linux server visually through the web interface. Remember:
- ⭐ Use
/host/in File Manager to access your actual server files - 🔐 Save your login credentials securely
- 🔒 Use SSH tunnel for the most secure access
Next steps: Explore Webmin's features, manage your server users, browse files, and configure system settings. Webmin makes server management much easier than using the command line!
15: BookStack - Documentation Platform / Wiki
BookStack is a beautiful, simple documentation and wiki platform. It helps you organize information into Books, Chapters, and Pages - just like a real book! You can write documentation, create knowledge bases, and share information with your team or the world.
For advanced features, API documentation, and customization options, see the official BookStack documentation.
Why BookStack?
- ✅ Easy to use - Write like you would in Word or Google Docs
- ✅ Organized structure - Books → Chapters → Pages
- ✅ Rich editor - WYSIWYG editor with Markdown support
- ✅ Full-text search - Find anything quickly across all your content
- ✅ Image uploads - Add pictures, diagrams, and attachments
- ✅ User permissions - Control who can view and edit what
- ✅ Export options - Download as PDF, HTML, or Markdown
- ✅ Beautiful design - Clean, modern interface that's easy on the eyes
- ✅ Fun fact: the platform you are seeing right now is BookStack – it hosts our docs.
Prerequisites
- ✅ Docker running (from Chapter 3)
- ✅ Optional: Traefik installed (from Chapter 4) for HTTPS access with a domain
- ✅ Optional: Subdomain (from Chapter 4.5), e.g.,
docs.yourdomain.com
Note: BookStack works best with Traefik and a domain name. It's designed for sharing documentation, so having a friendly URL like docs.yourdomain.com makes it much easier to access.
Step 1: Start Infinity Tools
sudo infinity-toolsStep 2: Install BookStack
- Go to 📱 APPLICATIONS
- Select BookStack
- Choose Install BookStack
Using the Infinity Tools GUI
- Use ↑/↓ to move, Enter to select, Esc to go back
- Look for the turquoise cursor indicating the current selection
- Each screen shows a short description at the top explaining what's needed
Step 2.1: Choose SSL Mode
You'll see two options. Here's what each means:
- Traefik (recommended)
- What it is: Uses your domain name with a trusted HTTPS certificate from Let's Encrypt
- What you need: A subdomain (e.g.,
docs.yourdomain.com) pointing to your server (see Chapter 4.5) - What you get: Professional URL like
https://docs.yourdomain.comwith trusted SSL - Pick this if: You want to share documentation with others (recommended)
- Standalone HTTPS (self-signed)
- What it is: Uses HTTPS with a self-signed certificate (your browser will warn it's not trusted)
- What you need: Just a free port (default: 8092)
- What you get: URL like
https://SERVER_IP:8092with a warning you must accept - Pick this if: You're just testing or only using it on your local network
Simple rule of thumb: Use Traefik if you have a domain and want to share your documentation. Use Standalone HTTPS only for testing or private use.
Step 2.2: If You Choose Traefik
- Enter your subdomain, e.g.,
docs.yourdomain.com - Ensure the subdomain's DNS A record points to your server (see Chapter 4.5)
- Enter your email address (for SSL certificate notifications)
- Infinity Tools will configure HTTPS automatically via Let's Encrypt
After install: Your BookStack will be available at https://docs.yourdomain.com
Step 2.3: If You Choose Standalone
- Pick a port (default: 8092)
- You'll access BookStack via
https://SERVER_IP:8092 - Accept the browser security warning (it's safe for private use)
What Happens During Installation
- BookStack container is created
- MariaDB database container is created
- Database passwords are generated and saved securely
- Data directory is set up at
/opt/speedbits/bookstack - Optional domain + Traefik HTTPS routing (if using Traefik)
- Services start and become accessible
- Initial setup takes 2-3 minutes (database initialization)
Step 3: Access BookStack
If Using Traefik
- Wait 30-60 seconds for SSL certificate generation
- Open
https://docs.yourdomain.comin your browser - You'll see the BookStack welcome page
If Using Standalone
- Open
https://SERVER_IP:8092in your browser - You'll see a security warning (normal for self-signed certificates)
- Click "Advanced" → "Proceed to site" to continue
- You'll see the BookStack welcome page
Step 4: First Login
⚠️ CRITICAL SECURITY STEP: BookStack comes with default admin credentials that MUST be changed immediately!
Default Credentials (First Time Only)
- Email:
admin@admin.com - Password:
password
⚠️ CHANGE THESE IMMEDIATELY! These are public defaults - anyone can guess them!
Login Steps
- Click "Login" in the top right corner
- Enter email:
admin@admin.com - Enter password:
password - Click "Log In"
Change Your Password Immediately
- After logging in, click your name in the top right corner
- Select "My Profile"
- Click "Change Password"
- Enter your current password (
password) - Enter a strong new password (use a password manager!)
- Confirm the new password
- Click "Save"
💡 Tip: Use a password manager (like Vaultwarden from Chapter 7) to generate and store a strong password!
Step 5: Create Your First Book
Now that you're logged in, let's create your first documentation book!
Creating a Book
- Click "Create Book" (usually a big button on the home page)
- Enter a book name, e.g., "My Server Documentation"
- Add a description (optional but helpful)
- Click "Save Book"
Adding Chapters
- Inside your book, click "Add Chapter"
- Enter a chapter name, e.g., "Getting Started"
- Add a description (optional)
- Click "Save Chapter"
Creating Pages
- Inside a chapter, click "Add Page"
- Enter a page title
- Start writing! Use the editor toolbar to format text, add images, create lists, etc.
- Click "Save Page" when done
Using the Editor
The BookStack editor is like Word or Google Docs:
- Bold and Italic buttons for formatting
- Headings dropdown (H1, H2, H3, etc.)
- Image upload button (📷 icon)
- Link button to add hyperlinks
- Code blocks for technical content
- Markdown support (you can type Markdown if you prefer)
What You Can Do in BookStack
Content Organization
- 📚 Books - Top-level containers (e.g., "Server Setup Guide")
- 📖 Chapters - Sections within books (e.g., "Installation", "Configuration")
- 📄 Pages - Individual documentation pages
- 🔄 Reordering - Drag and drop to reorganize content
Content Features
- ✍️ Rich text editor - WYSIWYG editing with Markdown support
- 🖼️ Image uploads - Add screenshots, diagrams, photos
- 📎 Attachments - Upload files (PDFs, documents, etc.)
- 🔍 Full-text search - Search across all books and pages
- 🏷️ Tags - Organize content with tags
Sharing & Export
- 👥 User roles - Control who can view/edit (Admin, Editor, Viewer)
- 🔗 Public links - Share specific pages publicly
- 📥 Export - Download as PDF, HTML, Markdown, or Plain Text
- 📋 Print - Print-friendly view
Security Recommendations
- ✅ Change default password immediately - This is critical!
- ✅ Use Traefik mode - Provides trusted SSL certificates
- ✅ Strong passwords - Use a password manager to generate strong passwords
- ✅ User permissions - Set appropriate roles (don't make everyone an admin!)
- ✅ Regular backups - BookStack data is stored in
/opt/speedbits/bookstack - ✅ Keep updated - Re-run the install script to get updates
- ⚠️ Public content - Be careful what you make public if using public links
Troubleshooting
Can't Access BookStack
- Traefik mode: Wait 30-60 seconds after installation for SSL certificate generation
- Check containers: Run
docker ps | grep bookstackto see if containers are running - Check logs: Run
docker logs bookstackto see error messages - Database issues: Check database container:
docker logs bookstack-db
Can't Login
- Make sure you're using the exact default credentials:
admin@admin.com/password - Check that BookStack finished initializing (wait 2-3 minutes after installation)
- Check container logs:
docker logs bookstack
Slow Loading
- First-time setup takes 2-3 minutes (database initialization)
- Large images can slow down pages - optimize images before uploading
- Check server resources:
docker stats bookstack
Lost Password
- If you forgot your password, you can reset it via the database
- Or reinstall with
--deleteallflag (⚠️ this deletes all content!) - Better: Keep your password in a password manager!
Where to Find BookStack After Install
- On the finish screen, Infinity Tools prints the access URL
- You can also see it in 📊 STATUS & HEALTH → STATUS
- Check the installation directory:
/opt/speedbits/bookstack - Database password saved in:
/opt/speedbits/bookstack/db_password.txt
Backing Up Your Documentation
Your BookStack content is stored in:
- Database:
/opt/speedbits/bookstack/db_data/ - Config:
/opt/speedbits/bookstack/config/ - Uploads: Inside the config directory
To backup:
cd /opt/speedbits
tar czf bookstack-backup.tar.gz bookstack/
To restore: Extract the backup and restart BookStack containers.
Email Configuration (Optional)
After installation, you'll be asked if you want to configure email (SMTP). This is optional but useful for:
- Password reset emails
- Notification emails when pages are updated
- User invitation emails
You can skip this and configure it later from the Infinity Tools menu or web interface.
You're Ready!
BookStack is now installed and ready to use. You can start creating beautiful documentation! Remember:
- 🔐 Change the default password immediately!
- 📚 Create books to organize your content
- ✍️ Use the rich editor to write beautiful documentation
- 🔍 Use search to find content quickly
- 👥 Invite team members and set appropriate permissions
Next steps: Create your first book, write some pages, upload images, and explore all the features. BookStack makes documentation fun and easy!
16: Uptime Kuma - Uptime Monitoring & Status Pages
Uptime Kuma is a beautiful, self-hosted monitoring tool that watches your websites, servers, and services 24/7. It tells you immediately when something goes down, shows you uptime statistics, and can even create public status pages (like status.github.com) to show your users that everything is working.
For advanced features, API documentation, and customization options, see the official Uptime Kuma documentation.
Why Uptime Kuma?
- ✅ 24/7 monitoring - Know immediately when something breaks
- ✅ Beautiful dashboard - See all your services at a glance with colorful graphs
- ✅ 90+ notification options - Get alerts via Discord, Slack, Email, Telegram, and many more
- ✅ Public status pages - Create beautiful status pages to share with your users
- ✅ Docker monitoring - Monitor your Docker containers automatically
- ✅ Multiple monitor types - Websites, APIs, ports, DNS, and more
- ✅ Uptime statistics - See how reliable your services are over time
- ✅ Free and open source - No subscription fees, runs on your server
Prerequisites
- ✅ Docker running (from Chapter 3)
- ✅ Optional: Traefik installed (from Chapter 4) for HTTPS access with a domain
- ✅ Optional: Subdomain (from Chapter 4.5), e.g.,
status.yourdomain.com
Note: Uptime Kuma works great with Traefik and a domain name. Having a friendly URL like status.yourdomain.com makes it easy to access your monitoring dashboard and share status pages.
Step 1: Start Infinity Tools
sudo infinity-toolsStep 2: Install Uptime Kuma
- Go to 📱 APPLICATIONS
- Select Uptime Kuma
- Choose Install Uptime Kuma
Using the Infinity Tools GUI
- Use ↑/↓ to move, Enter to select, Esc to go back
- Look for the turquoise cursor indicating the current selection
- Each screen shows a short description at the top explaining what's needed
Step 2.1: Choose SSL Mode
You'll see two options. Here's what each means:
- Traefik (recommended)
- What it is: Uses your domain name with a trusted HTTPS certificate from Let's Encrypt
- What you need: A subdomain (e.g.,
status.yourdomain.com) pointing to your server (see Chapter 4.5) - What you get: Professional URL like
https://status.yourdomain.comwith trusted SSL - Pick this if: You want secure, easy access with a domain name (recommended)
- Standalone HTTP
- What it is: Uses HTTP with direct port access (no SSL)
- What you need: Just a free port (default: 3001)
- What you get: URL like
http://SERVER_IP:3001 - Pick this if: You're just testing or only using it on your local network
Simple rule of thumb: Use Traefik if you have a domain and want secure access. Use Standalone HTTP only for testing or private use.
Step 2.2: If You Choose Traefik
- Enter your subdomain, e.g.,
status.yourdomain.com - Ensure the subdomain's DNS A record points to your server (see Chapter 4.5)
- Infinity Tools will configure HTTPS automatically via Let's Encrypt
After install: Your Uptime Kuma will be available at https://status.yourdomain.com
Step 2.3: If You Choose Standalone
- Pick a port (default: 3001)
- You'll access Uptime Kuma via
http://SERVER_IP:3001
Step 2.4: Docker Container Monitoring (Optional)
You'll be asked if you want to enable Docker container monitoring:
- Yes
- What it does: Uptime Kuma can monitor your Docker containers automatically
- What you get: Alerts when containers stop, health status monitoring
- Pick this if: You want to monitor your Docker containers (recommended if you use Docker)
- No
- What it does: Only monitors websites, APIs, and ports (not Docker containers)
- Pick this if: You don't use Docker or don't need container monitoring
Step 2.5: Timezone (Optional)
You can set your timezone for monitoring logs and graphs. Examples:
America/New_YorkEurope/LondonAsia/Tokyo
Leave empty for UTC (default).
What Happens During Installation
- Uptime Kuma container is created
- Data directory is set up at
/opt/speedbits/uptime-kuma - Optional domain + Traefik HTTPS routing (if using Traefik)
- Optional Docker socket access (if Docker monitoring enabled)
- Service starts and becomes accessible
Step 3: Access Uptime Kuma
If Using Traefik
- Wait 30-60 seconds for SSL certificate generation
- Open
https://status.yourdomain.comin your browser - You'll see the Uptime Kuma setup wizard
If Using Standalone
- Open
http://SERVER_IP:3001in your browser - You'll see the Uptime Kuma setup wizard
Step 4: Create Your Admin Account
⚠️ CRITICAL: Uptime Kuma requires you to create admin credentials on your FIRST login. There is NO default password!
Setup Steps
- You'll see: "Create your admin account"
- Enter a username (choose any username you like)
- Enter a password:
- Minimum: 8 characters
- Recommended: 12+ characters
- Best: 20+ characters (use a password manager!)
- ⚠️ WRITE DOWN YOUR CREDENTIALS IMMEDIATELY!
- This is your ONLY chance to set the initial password
- There is NO "forgot password" on first setup!
- Use a password manager (like Vaultwarden from Chapter 7) to store it securely
- Click "Create"
- ✅ Done! You'll see the monitoring dashboard
If You Forget Your Password
Don't worry! You can reset it using the command line:
- Run:
docker exec -it uptime-kuma npm run reset-password - Enter your username
- Enter a new password
- Log in with your new password
Step 5: Add Your First Monitor
Now that you're logged in, let's start monitoring something!
Adding a Monitor
- Click "Add New Monitor" (big button on the dashboard)
- Choose monitor type:
- HTTP(s) - Monitor websites and APIs
- TCP Port - Monitor if a port is open (SSH, databases, etc.)
- Ping - Check if a server responds
- Docker Container - Monitor Docker containers (if enabled)
- DNS - Check DNS records
- And more!
- Enter the URL or IP address to monitor
- Set check interval (default: 60 seconds - how often to check)
- Click "Save"
Example: Monitor Your Website
- Type: HTTP(s)
- URL:
https://yourdomain.com - Check interval: 60 seconds
- Click "Save"
Uptime Kuma will now check your website every 60 seconds and show you if it's up or down!
Step 6: Set Up Notifications
To get alerts when something goes down, you need to configure notifications.
Setting Up Notifications
- Go to: Settings → Notifications
- Click "Setup Notification"
- Choose a provider:
- Discord - Get alerts in Discord
- Slack - Get alerts in Slack
- Telegram - Get alerts via Telegram
- Email - Get alerts via email
- Apprise - Use Apprise for 80+ services (if you have Apprise installed)
- And 80+ more!
- Follow the setup instructions for your chosen provider
- Test the notification
- Click "Save"
Using Apprise (If Installed)
If you have Apprise installed (Chapter 5), you can use it for notifications:
- Type: Apprise (Self-hosted)
- URL:
http://apprise:8000/notify/{YOUR-KEY} - This lets you use all 80+ Apprise notification services!
Step 7: Create a Status Page (Optional)
Status pages let you show your users that your services are working. They're public (no login required) and look professional.
Creating a Status Page
- Go to: Status Pages
- Click "New Status Page"
- Enter a name, e.g., "My Services Status"
- Choose which monitors to display publicly
- Customize the appearance (colors, logo, etc.)
- Click "Save"
- Share the public URL with your users!
What You Can Monitor
Monitor Types
- 🌐 HTTP(s) websites - Check if websites are online
- 🔌 TCP ports - Check if ports are open (SSH, databases, etc.)
- 🏓 Ping (ICMP) - Check if servers respond
- 📝 DNS records - Check DNS configuration
- 🐳 Docker containers - Monitor container health (if enabled)
- 🔍 Keyword detection - Check if a page contains specific text
- 📧 SMTP email servers - Check if email servers work
- 💬 gRPC services - Monitor gRPC APIs
What You'll See
- 📊 Dashboard - All monitors at a glance with colorful status indicators
- 📈 Uptime graphs - See uptime percentages over time
- ⏱️ Response times - See how fast your services respond
- 📋 Incident history - See when things went down and came back up
- 🔔 Alerts - Get notified immediately when something breaks
Security Recommendations
- ✅ Use Traefik mode - Provides trusted SSL certificates
- ✅ Strong password - Use a password manager to generate strong passwords
- ✅ Enable 2FA - Go to Settings → Security → Two-Factor Auth
- ✅ Regular backups - Uptime Kuma data is stored in
/opt/speedbits/uptime-kuma - ✅ Protect admin panel - Monitoring data can be sensitive, keep it secure!
- ✅ Use status pages - Share public status pages instead of giving access to the admin panel
Troubleshooting
Can't Access Uptime Kuma
- Traefik mode: Wait 30-60 seconds after installation for SSL certificate generation
- Check containers: Run
docker ps | grep uptime-kumato see if container is running - Check logs: Run
docker logs uptime-kumato see error messages
Can't Create Admin Account
- Make sure you're accessing Uptime Kuma for the first time (no account exists yet)
- Check container logs:
docker logs uptime-kuma - Try resetting:
docker restart uptime-kuma
Monitors Not Working
- Check that the URL or IP address is correct
- Verify the service is actually running
- Check firewall rules (ports might be blocked)
- Look at monitor details for error messages
Notifications Not Sending
- Test the notification in Settings → Notifications
- Check notification provider settings (Discord webhook, email SMTP, etc.)
- Verify network connectivity from the container
Where to Find Uptime Kuma After Install
- On the finish screen, Infinity Tools prints the access URL
- You can also see it in 📊 STATUS & HEALTH → STATUS
- Check the installation directory:
/opt/speedbits/uptime-kuma - Data stored in:
/opt/speedbits/uptime-kuma/data
Backing Up Your Monitoring Data
Your Uptime Kuma data is stored in:
- Data directory:
/opt/speedbits/uptime-kuma/data
To backup:
cd /opt/speedbits
tar czf uptime-kuma-backup.tar.gz uptime-kuma/
To restore: Extract the backup and restart the Uptime Kuma container.
Or use Uptime Kuma's built-in backup: Go to Settings → Backup → Download Backup
You're Ready!
Uptime Kuma is now installed and ready to monitor your services! Remember:
- 🔐 Create your admin account on first login (no default password!)
- 📊 Add monitors to start tracking uptime
- 🔔 Set up notifications to get alerts
- 📄 Create status pages to share with users
- 🐳 Enable Docker monitoring if you use Docker containers
Next steps: Add monitors for your websites and services, configure notifications, and create a status page. Uptime Kuma will help you keep everything running smoothly!
17: Netdata - Real-time Performance Monitoring
Netdata is a powerful, real-time monitoring tool that shows you exactly what's happening on your server right now. It displays beautiful graphs of CPU, memory, disk, network, and Docker containers - updating every single second! Think of it as a real-time health dashboard for your entire server.
For advanced features, API documentation, and customization options, see the official Netdata documentation.
Why Netdata?
- ✅ Real-time monitoring - See updates every second, not every minute
- ✅ Beautiful graphs - Colorful, easy-to-read charts for everything
- ✅ Zero configuration - Works immediately after installation
- ✅ Auto-discovery - Automatically finds and monitors all Docker containers
- ✅ Low resource usage - Uses only ~50MB of RAM
- ✅ Comprehensive metrics - CPU, RAM, disk, network, processes, and more
- ✅ Alert notifications - Get notified when something goes wrong
- ✅ Historical data - See trends over time
Prerequisites
- ✅ Docker running (from Chapter 3)
- ✅ Optional: Traefik installed (from Chapter 4) for HTTPS access with a domain
- ✅ Optional: Subdomain (from Chapter 4.5), e.g.,
monitor.yourdomain.com - ✅ Optional: Apprise installed (from Chapter 5) for alert notifications
Note: Netdata works great with Traefik and a domain name. Having a friendly URL like monitor.yourdomain.com makes it easy to access your monitoring dashboard.
Step 1: Start Infinity Tools
sudo infinity-toolsStep 2: Install Netdata
- Go to 📱 APPLICATIONS
- Select Netdata
- Choose Install Netdata
Using the Infinity Tools GUI
- Use ↑/↓ to move, Enter to select, Esc to go back
- Look for the turquoise cursor indicating the current selection
- Each screen shows a short description at the top explaining what's needed
Step 2.1: Choose SSL Mode
You'll see two options. Here's what each means:
- Traefik (recommended)
- What it is: Uses your domain name with a trusted HTTPS certificate from Let's Encrypt
- What you need: A subdomain (e.g.,
monitor.yourdomain.com) pointing to your server (see Chapter 4.5) - What you get: Professional URL like
https://monitor.yourdomain.comwith trusted SSL - Pick this if: You want secure, easy access with a domain name (recommended)
- Standalone HTTP
- What it is: Uses HTTP with direct port access (no SSL)
- What you need: Just a free port (default: 19999)
- What you get: URL like
http://SERVER_IP:19999 - Pick this if: You're just testing or only using it on your local network
Simple rule of thumb: Use Traefik if you have a domain and want secure access. Use Standalone HTTP only for testing or private use.
Step 2.2: If You Choose Traefik
- Enter your subdomain, e.g.,
monitor.yourdomain.com - Ensure the subdomain's DNS A record points to your server (see Chapter 4.5)
- Infinity Tools will configure HTTPS automatically via Let's Encrypt
After install: Your Netdata will be available at https://monitor.yourdomain.com
Step 2.3: If You Choose Standalone
- Pick a port (default: 19999)
- You'll access Netdata via
http://SERVER_IP:19999
Step 2.4: Multi-Server Monitoring (Optional)
You'll be asked if you want to stream metrics to a Netdata Director (parent server):
- Yes
- What it does: Sends all metrics to a central dashboard
- What you need: A Netdata Director server already set up
- What you get: Centralized monitoring of multiple servers
- Pick this if: You have multiple servers and want one dashboard for all
- No (default)
- What it does: Standalone monitoring (this server only)
- Pick this if: You're just monitoring one server
Step 2.5: Apprise Notifications (Optional)
If you have Apprise installed (Chapter 5), you can enable alert notifications:
- Yes
- What it does: Sends alerts to Apprise when CPU, RAM, or disk usage is high
- What you get: Notifications via Discord, Slack, Email, etc. (all Apprise services)
- Pick this if: You want to get alerts when something goes wrong
- No
- What it does: No alert notifications
- Pick this if: You just want to view metrics, no alerts
What Happens During Installation
- Netdata container is created
- Data directories are set up at
/opt/speedbits/netdata-client - Optional domain + Traefik HTTPS routing (if using Traefik)
- Docker socket access configured (for container monitoring)
- Custom alerts configured (CPU, RAM, disk)
- Optional Apprise integration (if enabled)
- Service starts and becomes accessible
Step 3: Access Netdata
If Using Traefik
- Wait 30-60 seconds for SSL certificate generation
- Open
https://monitor.yourdomain.comin your browser - You'll see the Netdata dashboard immediately!
If Using Standalone
- Open
http://SERVER_IP:19999in your browser - You'll see the Netdata dashboard immediately!
⚠️ IMPORTANT SECURITY NOTE: Netdata has NO username/password protection by default! Anyone who can access the URL can see your monitoring data. If using Traefik, strongly consider adding Basic Auth protection. If using standalone mode, keep it on a private network only!
Step 4: Understanding the Dashboard
When you first open Netdata, you'll see a beautiful dashboard with lots of graphs. Here's what everything means:
Main Sections
- 📊 System Overview - CPU, RAM, disk, network at a glance
- 🐳 Docker Containers - All your containers with individual metrics
- 💾 Disk I/O - How fast your disks are reading/writing
- 🌐 Network - Network traffic and connections
- ⚙️ System Load - How busy your server is
- 📈 Processes - Individual programs and their resource usage
Reading the Graphs
- Green - Normal, healthy values
- Yellow - Warning (getting high)
- Red - Critical (too high!)
- Time axis - Shows last hour by default (can zoom in/out)
- Real-time - Updates every second automatically
Key Metrics to Watch
- 💻 CPU Usage - Should be under 80% most of the time
- 🧠 RAM Usage - Should be under 80% most of the time
- 💾 Disk Usage - Should be under 80% (watch for low disk space!)
- 🌐 Network Traffic - Shows incoming/outgoing data
- 🐳 Container Status - All containers should be running
Step 5: Docker Container Monitoring
One of Netdata's best features is automatic Docker container discovery and monitoring!
What You'll See
- All your Docker containers listed automatically
- Individual CPU, RAM, disk, and network usage for each container
- Container health status
- Real-time graphs for each container
How to Use It
- Click on "Docker" in the left sidebar
- You'll see all your containers listed
- Click on any container to see its detailed metrics
- Watch for containers using too much CPU or RAM
Step 6: Alert Notifications (If Enabled)
If you enabled Apprise notifications, Netdata will automatically send alerts when:
- ⚠️ CPU usage > 80% (warning) or > 95% (critical)
- ⚠️ RAM usage > 80% (warning) or > 95% (critical)
- ⚠️ Disk space > 80% (warning) or > 90% (critical)
How Alerts Work
- Netdata detects a problem (e.g., CPU too high)
- Sends alert to Apprise
- Apprise forwards to your configured channels (Discord, Slack, Email, etc.)
- You get notified immediately!
Customizing Alerts
You can customize alert thresholds by editing configuration files:
nano /opt/speedbits/netdata-client/netdata/health.d/cpu_usage.confChange the warning/critical thresholds to your preferences.
Security Recommendations
- ✅ Use Traefik mode - Provides trusted SSL certificates
- ✅ Add Basic Auth - Protect dashboard with username/password (strongly recommended!)
- ✅ Private network only - If using standalone mode, don't expose to internet
- ✅ Use VPN - Access via WireGuard VPN (Chapter 18) for secure remote access
- ✅ SSH tunnel - Use SSH tunnel for secure access:
ssh -L 19999:localhost:19999 user@server - ⚠️ No default protection - Netdata has NO username/password by default - protect it!
Adding Basic Auth Protection
If using Traefik, you can add username/password protection:
- Run:
sudo bash Infrastructure/websiteprotection.sh - Select "netdata"
- Enter username and password
- Now your dashboard is protected!
Troubleshooting
Can't Access Netdata
- Traefik mode: Wait 30-60 seconds after installation for SSL certificate generation
- Check containers: Run
docker ps | grep netdatato see if container is running - Check logs: Run
docker logs netdatato see error messages
No Docker Containers Showing
- Make sure Docker is running:
docker ps - Check that Docker socket is accessible:
docker exec netdata ls /var/run/docker.sock - Restart Netdata:
docker restart netdata
Alerts Not Working
- Check that Apprise is running:
docker ps | grep apprise - Verify Apprise network connectivity
- Check Netdata logs:
docker logs netdata - Test alert thresholds (trigger a test alert)
High Resource Usage
- Netdata uses ~50MB RAM (very low!)
- If seeing high CPU, check how many containers you're monitoring
- Consider reducing data retention period
Where to Find Netdata After Install
- On the finish screen, Infinity Tools prints the access URL
- You can also see it in 📊 STATUS & HEALTH → STATUS
- Check the installation directory:
/opt/speedbits/netdata-client - Configuration files:
/opt/speedbits/netdata-client/netdata/
Useful Features
Historical Data
Netdata stores historical data so you can see trends over time:
- Zoom in/out on graphs to see different time periods
- Compare current vs. past performance
- Identify patterns and trends
Exporting Data
You can export graphs and data:
- Click on any graph to see export options
- Export as image (PNG)
- Share graphs with others
Custom Dashboards
Netdata allows you to create custom dashboards:
- Focus on specific metrics
- Create views for different purposes
- Save favorite views
You're Ready!
Netdata is now installed and monitoring your server in real-time! Remember:
- 🔐 Protect your dashboard with Basic Auth (strongly recommended!)
- 📊 Check the dashboard regularly to understand your server's health
- 🔔 Set up alerts to get notified of problems
- 🐳 Use Docker monitoring to track container health
- 📈 Use historical data to identify trends and plan capacity
Next steps: Explore the dashboard, check your Docker containers, set up alerts, and use Netdata to keep your server running smoothly!
18: Netdata Director - Multi-Server Monitoring Hub
Netdata Director is a centralized monitoring dashboard that lets you monitor multiple servers from one place. Instead of opening separate dashboards for each server, you get one unified view showing all your servers' metrics, alerts, and performance data. Think of it as a command center for all your infrastructure!
⚠️ IMPORTANT: Netdata Director is a Pro+ feature that requires a license. For single-server monitoring, use regular Netdata (Chapter 17) which is free.
For advanced features, API documentation, and customization options, see the official Netdata documentation.
Why Netdata Director?
- ✅ One dashboard for all servers - Monitor everything from one place
- ✅ Unified view - See all your servers' metrics together
- ✅ Centralized alerts - Get notifications from all servers in one place
- ✅ Historical data - Long-term storage for all monitored servers
- ✅ Node comparison - Compare performance across servers
- ✅ Easy management - Add or remove servers easily
- ✅ Scalable - Monitor unlimited servers
Director vs Regular Netdata
Regular Netdata (Free)
- ✅ Monitor individual servers separately
- ✅ Each server has its own dashboard
- ✅ Free and open source
- ❌ Must open multiple dashboards for multiple servers
- ❌ No unified view
Netdata Director (Pro+)
- ✅ Monitor ALL servers from one dashboard
- ✅ Unified monitoring interface
- ✅ Centralized alerts and management
- ✅ Historical data for all servers
- ⚠️ Requires Pro+ license
Prerequisites
- ✅ Pro+ License - Netdata Director requires a Pro+ license
- ✅ Docker running (from Chapter 3)
- ✅ Optional: Traefik installed (from Chapter 4) for HTTPS access with a domain
- ✅ Optional: Subdomain (from Chapter 4.5), e.g.,
monitoring.yourdomain.com - ✅ Optional: Apprise installed (from Chapter 5) for alert notifications
- ✅ Multiple servers - Director is most useful when monitoring 2+ servers
Note: Netdata Director works best with Traefik and a domain name. Having a friendly URL like monitoring.yourdomain.com makes it easy to access your centralized dashboard.
How It Works
Netdata Director uses a parent-child architecture:
Director (Parent)
- The central dashboard server
- Receives metrics from all child nodes
- Displays unified view of all servers
- Manages alerts for all servers
Child Nodes
- Regular Netdata installations on each server
- Stream metrics to the Director
- Can still have their own dashboards (optional)
- Automatically appear in Director dashboard
Step 1: Verify Pro+ License
Before installing, make sure you have a Pro+ license. The installation script will check for this automatically.
If you don't have a Pro+ license:
- Visit: https://speedbits.io/infinity-tools/
- Email: sales@speedbits.io
- Support: support@speedbits.io
Step 2: Start Infinity Tools
sudo infinity-toolsStep 3: Install Netdata Director
- Go to 📱 APPLICATIONS
- Select Netdata Director
- Choose Install Netdata Director
Using the Infinity Tools GUI
- Use ↑/↓ to move, Enter to select, Esc to go back
- Look for the turquoise cursor indicating the current selection
- Each screen shows a short description at the top explaining what's needed
Step 3.1: Choose SSL Mode
You'll see two options. Here's what each means:
- Traefik (recommended)
- What it is: Uses your domain name with a trusted HTTPS certificate from Let's Encrypt
- What you need: A subdomain (e.g.,
monitoring.yourdomain.com) pointing to your server (see Chapter 4.5) - What you get: Professional URL like
https://monitoring.yourdomain.comwith trusted SSL - Pick this if: You want secure, easy access with a domain name (recommended)
- Standalone HTTP
- What it is: Uses HTTP with direct port access (no SSL)
- What you need: Just a free port (default: 19999)
- What you get: URL like
http://SERVER_IP:19999 - Pick this if: You're just testing or only using it on your local network
Step 3.2: If You Choose Traefik
- Enter your subdomain, e.g.,
monitoring.yourdomain.com - Ensure the subdomain's DNS A record points to your server (see Chapter 4.5)
- Infinity Tools will configure HTTPS automatically via Let's Encrypt
After install: Your Netdata Director will be available at https://monitoring.yourdomain.com
Step 3.3: Apprise Notifications (Optional)
If you have Apprise installed (Chapter 5), you can enable centralized alert notifications:
- Yes
- What it does: Sends alerts from ALL monitored servers to Apprise
- What you get: One notification channel for all servers
- Pick this if: You want centralized alerting
- No
- What it does: No alert notifications
- Pick this if: You just want monitoring, no alerts
Step 3.4: Save Your Stream API Key
⚠️ CRITICAL: During installation, a Stream API Key will be generated. This key is used to connect child nodes to the Director.
- Write down the API key immediately!
- Save it in a password manager (like Vaultwarden)
- You'll need this key when configuring child nodes
- The key is also saved in:
/opt/speedbits/netdata-director/stream-api-key.txt
What Happens During Installation
- Netdata Director container is created
- Data directories are set up at
/opt/speedbits/netdata-director - Stream API key is generated and saved
- Optional domain + Traefik HTTPS routing (if using Traefik)
- Optional Apprise integration (if enabled)
- Service starts and becomes accessible
Step 4: Access Netdata Director
If Using Traefik
- Wait 30-60 seconds for SSL certificate generation
- Open
https://monitoring.yourdomain.comin your browser - You'll see the Director dashboard!
If Using Standalone
- Open
http://SERVER_IP:19999in your browser - You'll see the Director dashboard!
⚠️ IMPORTANT SECURITY NOTE: Netdata Director has NO username/password protection by default! However, you CANNOT use Basic Auth because it blocks child nodes from streaming data. Instead, use firewall rules, VPN access, or Netdata Cloud for security.
Step 5: Connect Child Nodes
Now that Director is running, you need to connect your other servers (child nodes) to it.
On Each Server You Want to Monitor
- SSH into the server
- Run:
sudo infinity-tools - Go to 📱 APPLICATIONS → Netdata → Install
- When asked about streaming, choose Yes
- Enter Director details:
- Director hostname/IP: The Director server's IP or domain
- Director port: 19999 (or your custom port)
- Stream API key: The key you saved during Director installation
- Complete the installation
What Happens Next
- Child node starts streaming metrics to Director
- Wait 1-2 minutes for connection to establish
- Child node appears in Director dashboard dropdown
- You can now switch between servers in the Director dashboard!
Step 6: Using the Director Dashboard
Switching Between Servers
- Open the Director dashboard
- Look for a dropdown menu (usually top-left or top-right)
- Select a server from the dropdown
- Dashboard updates to show that server's metrics
What You'll See
- 📊 Unified view - All servers listed in dropdown
- 📈 Real-time metrics - Same as regular Netdata, but for all servers
- 🔔 Centralized alerts - Alerts from all servers
- 📉 Historical data - Long-term storage for all servers
- 🔍 Node comparison - Compare metrics across servers
Security Recommendations
- ✅ Use Traefik mode - Provides trusted SSL certificates
- ✅ Firewall protection - Restrict access to trusted IPs only
- ✅ VPN access - Use WireGuard VPN (Chapter 18) for secure remote access
- ✅ Keep API key secret - Only share with trusted servers
- ⚠️ NO Basic Auth - Cannot use Basic Auth (blocks child nodes)
- ⚠️ Protect Director - Director shows ALL server metrics - protect it!
Security Options
Since Basic Auth doesn't work with Director, use these alternatives:
- Option 1: Firewall (Best)
- Use UFW to allow only trusted IPs
- Example:
ufw allow from CHILD_NODE_IP to any port 443
- Option 2: VPN/WireGuard
- Access Director only through WireGuard VPN
- Keep Director on internal network
- Option 3: Netdata Cloud
- Use Netdata's official cloud service
- Includes authentication and team management
- Visit: https://app.netdata.cloud
Troubleshooting
Can't Access Director
- Traefik mode: Wait 30-60 seconds after installation for SSL certificate generation
- Check containers: Run
docker ps | grep netdata-directorto see if container is running - Check logs: Run
docker logs netdata-directorto see error messages
Child Nodes Not Appearing
- Wait 1-2 minutes after connecting (connection takes time)
- Verify API key is correct on child node
- Check network connectivity between child and Director
- Check Director logs:
docker logs netdata-director - Verify child node is streaming: Check child node logs
Lost API Key
- View saved key:
cat /opt/speedbits/netdata-director/stream-api-key.txt - Or check Director configuration:
cat /opt/speedbits/netdata-director/netdata/stream.conf
Where to Find Netdata Director After Install
- On the finish screen, Infinity Tools prints the access URL
- You can also see it in 📊 STATUS & HEALTH → STATUS
- Check the installation directory:
/opt/speedbits/netdata-director - API key saved in:
/opt/speedbits/netdata-director/stream-api-key.txt - Configuration files:
/opt/speedbits/netdata-director/netdata/
Useful Features
Data Retention
Director stores historical data for all servers:
- High-resolution: 1 hour (1-second granularity)
- Mid-resolution: 1 day (1-minute granularity)
- Low-resolution: 30 days (15-minute granularity)
Centralized Alerts
If Apprise is enabled, you'll get alerts from all servers:
- Alerts include server hostname
- One notification channel for all servers
- Easier to manage than individual alerts
You're Ready!
Netdata Director is now installed and ready to monitor multiple servers! Remember:
- 🔐 Protect your Director with firewall or VPN (cannot use Basic Auth)
- 🔑 Keep your Stream API key secret
- 📊 Connect child nodes to start monitoring
- 🔔 Set up centralized alerts for all servers
- 📈 Use the unified dashboard to monitor everything
Next steps: Connect your first child node, verify it appears in the dashboard, and start monitoring all your servers from one place!
19: Installing WireGuard - Secure VPN Access
WireGuard is a modern, fast, and secure VPN (Virtual Private Network) that lets you access your server and its services securely from anywhere. Once connected, you can access internal services, manage your server, and browse securely - all encrypted and protected!
For advanced features, API documentation, and technical details, see the official WireGuard documentation.
Why WireGuard?
- ✅ Secure access - Access your server and services securely from anywhere
- ✅ Easy to use - Web interface makes managing clients simple
- ✅ Fast and modern - Uses modern encryption (ChaCha20) for speed and security
- ✅ Mobile-friendly - QR codes for easy mobile device setup
- ✅ Multiple devices - Connect phones, laptops, tablets - all from one server
- ✅ Split tunneling - Only VPN traffic goes through VPN, rest uses normal internet
- ✅ Low overhead - Minimal impact on your internet speed
Prerequisites
- ✅ Docker running (from Chapter 3)
- ✅ Linux kernel 5.6+ - Most modern Linux distributions have this
- ✅ Optional: Traefik installed (from Chapter 4) for HTTPS access with a domain
- ✅ Optional: Subdomain (from Chapter 4.5), e.g.,
vpn.yourdomain.com - ✅ Firewall access - Ability to open UDP port (default: 51820)
Note: WireGuard works great with Traefik and a domain name. Having a friendly URL like vpn.yourdomain.com makes it easy to access the web management interface.
Step 1: Start Infinity Tools
sudo infinity-toolsStep 2: Install WireGuard
- Go to 📱 APPLICATIONS
- Select WireGuard
- Choose Install WireGuard
Using the Infinity Tools GUI
- Use ↑/↓ to move, Enter to select, Esc to go back
- Look for the turquoise cursor indicating the current selection
- Each screen shows a short description at the top explaining what's needed
Step 2.1: Network Configuration
You'll be asked to configure two networks:
VPN Network (Default: 10.13.13)
- What it is: The network used by WireGuard clients and Docker services
- What you get: Clients get IPs like 10.13.13.3, 10.13.13.4, etc.
- Default: 10.13.13 (usually fine to accept)
- Pick this if: You want the default setup (recommended)
Host Network (Default: 10.13.14)
- What it is: The network used for accessing host services (like Webmin, Apprise)
- What you get: Host services accessible at 10.13.14.1
- Default: 10.13.14 (usually fine to accept)
- Pick this if: You want the default setup (recommended)
💡 Tip: Unless you have a specific reason, accept the defaults (just press Enter).
Step 2.2: DNS Configuration
WireGuard will automatically detect your server's DNS settings. This ensures VPN clients use the same DNS as your server for consistency.
Usually, you can just accept the auto-detected DNS (press Enter).
Step 2.3: Choose SSL Mode
You'll see two options. Here's what each means:
- Traefik (optional)
- What it is: Uses your domain name with a trusted HTTPS certificate from Let's Encrypt
- What you need: A subdomain (e.g.,
vpn.yourdomain.com) pointing to your server (see Chapter 4.5) - What you get: Professional URL like
https://vpn.yourdomain.comwith trusted SSL - Pick this if: You want secure, easy access with a domain name
- Standalone (recommended)
- What it is: Uses HTTPS with a self-signed certificate and direct port access
- What you need: Just a free port (default: 8445)
- What you get: URL like
https://SERVER_IP:8445with a warning you must accept once - Pick this if: You don't have a domain or prefer direct access (recommended)
Simple rule of thumb: Use Standalone for most cases. Use Traefik if you have a domain and want trusted SSL.
Step 2.4: VPN Port Configuration
You'll be asked for the UDP port for VPN connections:
- Default: 51820
- What it is: The port clients will connect to
- Important: You must open this port in your firewall!
- Pick this if: Default is fine (recommended)
Step 2.5: Server Endpoint
You'll be asked for your server's public IP address or domain name:
- What it is: How clients will find your server
- Examples:
123.45.67.89orvpn.yourdomain.com - Important: This must be accessible from the internet!
What Happens During Installation
- WireGuard kernel module is installed (if needed)
- WireGuard container is created
- Web management interface is set up
- Random password is generated for web UI
- Host network interface is created
- Network routing is configured
- Service starts and becomes accessible
Step 3: Open Firewall Port
⚠️ CRITICAL: You MUST open the VPN port in your firewall, or clients cannot connect!
Opening the Port
sudo ufw allow 51820/udpReplace 51820 with your custom port if you chose a different one.
Why This Matters
- Without this, VPN clients cannot connect to your server
- The port must be UDP (not TCP)
- This is the ONLY port you need to open for VPN access
Step 4: Access WireGuard Web Interface
If Using Traefik
- Wait 30-60 seconds for SSL certificate generation
- Open
https://vpn.yourdomain.comin your browser - You'll see the WireGuard login page
If Using Standalone
- Open
https://SERVER_IP:8445in your browser - You'll see a security warning (normal for self-signed certificates)
- Click "Advanced" → "Proceed to site" to continue
- You'll see the WireGuard login page
Step 5: Login to Web Interface
⚠️ CRITICAL: During installation, a random password was generated and displayed. Save it immediately!
Default Credentials
- Username:
admin - Password: Randomly generated (shown during installation)
If You Lost the Password
You can retrieve it from:
cat /opt/speedbits/wireguard/web-password.txtLogin Steps
- Enter username:
admin - Enter the password shown during installation
- Click "Login"
- You'll see the WireGuard dashboard!
Step 6: Create Your First VPN Client
Now that you're logged in, let's create your first VPN client!
Adding a Client
- Click "Add Client" or the "+" button
- Enter a name for your device, e.g., "My Phone", "Laptop", "Work PC"
- Configure settings (or use defaults):
- Allowed IPs: Usually auto-filled (VPN network + Host network)
- Use Server DNS: Usually enabled (recommended)
- Click "Save" or "Create"
- You'll see a QR code and download options!
What You'll Get
- 📱 QR Code - Scan with mobile devices
- 📄 Config File - Download for Windows/Linux
- 🔑 Client Details - IP address, public key, etc.
Step 7: Set Up WireGuard on Your Device
Windows
- Install WireGuard from Microsoft Store
- Open WireGuard app
- Click "Add Tunnel" → "Import from file"
- Select the downloaded .conf file
- Click "Activate" to connect
Android/iOS/macOS
- Install WireGuard app from Play Store/App Store
- Open WireGuard app
- Tap "+" → "Create from QR code"
- Scan the QR code from the web interface
- Tap "Activate" to connect
Linux
- Install WireGuard:
sudo apt install wireguard - Copy the .conf file to:
/etc/wireguard/wg0.conf - Start WireGuard:
sudo wg-quick up wg0 - Enable auto-start:
sudo systemctl enable wg-quick@wg0
Step 8: Understanding VPN Networks
WireGuard creates two networks for different purposes:
VPN Network (10.13.13.0/24)
This network is for WireGuard clients and Docker services:
- 📱 Your devices - Get IPs like 10.13.13.3, 10.13.13.4, etc.
- 🐳 Docker services - Accessible via their container names
- 🌐 Examples:
- Vaultwarden:
http://vaultwarden:80 - WordPress:
http://wordpress:80 - Apprise:
http://apprise:8000
- Vaultwarden:
Host Network (10.13.14.0/24)
This network is for accessing host services (services running directly on the server):
- 🖥️ Host services - Accessible at 10.13.14.1
- 🌐 Examples:
- Webmin:
https://10.13.14.1:8443 - Apprise:
http://10.13.14.1:8444 - SSH:
ssh user@10.13.14.1
- Webmin:
What You Can Access via VPN
Docker Services (VPN Network)
- All your Infinity Tools applications
- Access via container names (e.g.,
http://vaultwarden:80) - No need to expose ports publicly!
Host Services (Host Network)
- Webmin (if installed)
- Apprise (if installed)
- SSH access
- Any other services running on the host
Security Recommendations
- ✅ Open only VPN port - Close other public ports (Webmin, Apprise, etc.)
- ✅ Use strong password - The generated password is strong, keep it safe!
- ✅ Store password securely - Use a password manager (Vaultwarden recommended!)
- ✅ Limit client access - Only create clients for trusted devices
- ✅ Disable unused clients - Turn off clients you're not using
- ✅ Keep WireGuard updated - Re-run install script periodically for updates
- ⚠️ Protect web interface - The web UI manages all VPN clients - keep it secure!
Firewall Best Practices
After setting up WireGuard, you can close other public ports:
# Close Webmin public access (access via VPN instead)
sudo ufw delete allow 8443

# Close Apprise public access (access via VPN instead)
sudo ufw delete allow 8444

# Close WireGuard web UI public access (access via VPN instead)
sudo ufw delete allow 8445
Now access everything securely via VPN!
Troubleshooting
Can't Connect to VPN
- Check firewall: Make sure UDP port 51820 (or your custom port) is open
- Check server endpoint: Verify the IP/domain is correct and accessible
- Check client config: Make sure you're using the correct .conf file
- Check WireGuard status: Run
docker logs wireguardto see errors
Can't Access Web Interface
- Traefik mode: Wait 30-60 seconds after installation for SSL certificate generation
- Standalone mode: Accept the self-signed certificate warning
- Check container: Run
docker ps | grep wireguardto see if it's running - Check logs: Run
docker logs wireguardto see error messages
Can't Access Services via VPN
- Check VPN connection: Make sure WireGuard is connected on your device
- Check IP address: Verify you're using the correct IPs (10.13.13.x or 10.13.14.1)
- Check Allowed IPs: Make sure client config includes both VPN and Host networks
- Check routing: Verify network routing is configured correctly
Lost Web UI Password
- View saved password:
cat /opt/speedbits/wireguard/web-password.txt - If file doesn't exist, you'll need to reinstall WireGuard
Where to Find WireGuard After Install
- On the finish screen, Infinity Tools prints the web interface URL and password
- You can also see it in 📊 STATUS & HEALTH → STATUS
- Check the installation directory:
/opt/speedbits/wireguard - Password saved in:
/opt/speedbits/wireguard/web-password.txt - Client configs:
/opt/speedbits/wireguard/data/(managed via web UI)
Managing VPN Clients
Adding More Clients
Simply repeat Step 6 for each device you want to connect. Each device gets its own unique IP address.
Disabling Clients
In the web interface, you can disable clients without deleting them. This is useful if you temporarily don't want a device to connect.
Viewing Connection Stats
The web interface shows connection statistics for each client, including data transferred and connection time.
You're Ready!
WireGuard is now installed and ready to use! Remember:
- 🔥 Open the firewall port (UDP 51820) - critical for connections!
- 🔐 Save your web UI password securely
- 📱 Create clients via the web interface
- 🔒 Close other public ports and access everything via VPN
- 🌐 Use VPN network (10.13.13.x) for Docker services
- 🖥️ Use Host network (10.13.14.1) for host services
Next steps: Create your first client, set up WireGuard on your device, test the connection, and start accessing your services securely from anywhere!
20: Warpgate - Secure SSH Gateway
Warpgate is a secure SSH gateway (also called a "bastion host") that provides a web interface for managing SSH access to your server. Instead of connecting directly to your server, you connect through Warpgate, which adds an extra layer of security and makes it easier to manage who can access what.
For advanced features, API documentation, and technical details, see the official Warpgate documentation.
Why Warpgate?
- ✅ Secure SSH gateway - All SSH connections go through Warpgate
- ✅ Web-based management - Easy-to-use web interface for managing access
- ✅ User access control - Control who can access which servers
- ✅ Session recording - Keep track of SSH sessions for security
- ✅ No direct server access - Server SSH port can be closed, only Warpgate port open
- ✅ Centralized access - Manage all SSH access from one place
- ✅ Better security - Reduces attack surface by closing direct SSH access
Prerequisites
- ✅ Docker running (from Chapter 3)
- ✅ Optional: Traefik installed (from Chapter 4) for HTTPS access with a domain
- ✅ Optional: Subdomain (from Chapter 4.5), e.g.,
warpgate.yourdomain.com - ✅ Firewall access - Ability to open port 2222 (SSH) and optionally close port 22
Note: Warpgate works great with Traefik and a domain name. Having a friendly URL like warpgate.yourdomain.com makes it easy to access the web management interface.
Step 1: Start Infinity Tools
sudo infinity-toolsStep 2: Install Warpgate
- Go to 📱 APPLICATIONS
- Select Warpgate
- Choose Install Warpgate
Using the Infinity Tools GUI
- Use ↑/↓ to move, Enter to select, Esc to go back
- Look for the turquoise cursor indicating the current selection
- Each screen shows a short description at the top explaining what's needed
Step 2.1: Choose SSL Mode
You'll see two options. Here's what each means:
- Traefik (recommended)
- What it is: Uses your domain name with a trusted HTTPS certificate from Let's Encrypt
- What you need: A subdomain (e.g.,
warpgate.yourdomain.com) pointing to your server (see Chapter 4.5) - What you get: Professional URL like
https://warpgate.yourdomain.comwith trusted SSL - Pick this if: You have a domain and want secure, easy access (recommended)
- Standalone
- What it is: Uses HTTPS with a self-signed certificate and direct port access
- What you need: Just a free port (default: 8888)
- What you get: URL like
https://SERVER_IP:8888with a warning you must accept once - Pick this if: You don't have a domain or prefer direct access
Simple rule of thumb: Use Traefik if you have a domain (recommended). Use Standalone if you don't have a domain.
Step 2.2: Domain Configuration (Traefik Mode)
If you chose Traefik, you'll be asked for your domain:
- What it is: The subdomain where Warpgate will be accessible
- Example:
warpgate.yourdomain.com - Important: DNS must already point to your server (see Chapter 4.5)
Step 2.3: Port Configuration (Standalone Mode)
If you chose Standalone, you'll be asked for a port:
- Default: 8888
- What it is: The port for the web interface
- Note: SSH port (2222) is always exposed directly
What Happens During Installation
- Warpgate container is created
- Data directory is set up
- Web interface becomes accessible
- SSH gateway starts on port 2222
- Interactive setup prompts for admin credentials
Step 3: Set Up Admin Account
After installation, Warpgate will run an interactive setup. You'll be prompted to create an admin account:
Admin Setup Prompts
- Admin username: Choose a username for the admin account (e.g.,
admin) - Admin password: Choose a strong password (you'll use this to log into the web interface)
- Confirm password: Enter the password again to confirm
⚠️ IMPORTANT: Save these credentials immediately! You'll need them to access the web interface.
Step 4: Access Warpgate Web Interface
If Using Traefik
- Wait 30-60 seconds for SSL certificate generation
- Open
https://warpgate.yourdomain.comin your browser - You'll see the Warpgate login page
If Using Standalone
- Open
https://SERVER_IP:8888in your browser - You'll see a security warning (normal for self-signed certificates)
- Click "Advanced" → "Proceed to site" to continue
- You'll see the Warpgate login page
Step 5: Login to Web Interface
- Enter the admin username you created during setup
- Enter the admin password you created during setup
- Click "Login"
- You'll see the Warpgate dashboard!
Step 6: Understanding Warpgate
Warpgate acts as a gateway (or "bastion") between you and your server:
How It Works
- Before Warpgate: You connect directly to your server via SSH (port 22)
- With Warpgate: You connect to Warpgate (port 2222), which then connects you to your server
- Benefits: All SSH access goes through Warpgate, making it easier to manage and secure
What You Can Do
- ✅ Manage users - Add users who can access servers through Warpgate
- ✅ Control access - Decide which users can access which servers
- ✅ View sessions - See who's connected and what they're doing
- ✅ Record sessions - Keep logs of SSH sessions for security
- ✅ Manage targets - Add servers that users can connect to
Step 7: Add Your First Target (Server)
Before users can connect, you need to add a "target" (the server they'll connect to):
Adding a Target
- In the web interface, go to "Targets" or "Servers"
- Click "Add Target" or the "+" button
- Enter target details:
- Name: A friendly name (e.g., "My Server")
- Host: The server's IP address or hostname (usually
localhostor127.0.0.1for the same server) - Port: SSH port (usually
22) - Username: The SSH username (e.g., your server username)
- Click "Save" or "Create"
For Same-Server Access
If Warpgate is running on the same server you want to access:
- Host:
localhostor127.0.0.1 - Port:
22(or your server's SSH port) - Username: Your server username
Step 8: Add Users
Now add users who can connect through Warpgate:
Adding a User
- In the web interface, go to "Users"
- Click "Add User" or the "+" button
- Enter user details:
- Username: A username for Warpgate (e.g., "john")
- Password: A password for this user
- Email: Optional email address
- Click "Save" or "Create"
Granting Access
After creating a user, grant them access to targets:
- Go to the user's profile
- Find "Access" or "Targets" section
- Select which targets this user can access
- Save the changes
Step 9: Connect via SSH Through Warpgate
Now you can connect to your server through Warpgate:
SSH Connection
ssh -p 2222 warpgate-user@warpgate.yourdomain.comOr if using standalone mode:
ssh -p 2222 warpgate-user@SERVER_IPWhat Happens
- You connect to Warpgate on port 2222
- Warpgate asks for your Warpgate username and password
- After authentication, Warpgate shows you available targets
- You select which target (server) you want to connect to
- Warpgate connects you to that server
First-Time Connection
On your first connection, you'll see:
- Warpgate login prompt
- Enter your Warpgate username and password
- List of available targets
- Select a target to connect
- You're now connected to your server!
Step 10: Security Best Practices
Close Direct SSH Access
Once Warpgate is working, you can close direct SSH access to your server:
# Close port 22 (direct SSH)
sudo ufw delete allow 22/tcp

# Keep port 2222 open (Warpgate SSH)
sudo ufw allow 2222/tcp
⚠️ WARNING: Only do this after testing Warpgate! Make sure you can connect through Warpgate before closing port 22.
Firewall Configuration
- ✅ Open port 2222 - Required for Warpgate SSH access
- ✅ Open port 80/443 - If using Traefik (for web interface)
- ✅ Open port 8888 - If using standalone mode (for web interface)
- ⚠️ Close port 22 - After testing Warpgate (optional but recommended)
User Management
- ✅ Use strong passwords - For both admin and user accounts
- ✅ Limit access - Only grant access to targets users need
- ✅ Regularly review users - Remove users who no longer need access
- ✅ Monitor sessions - Check who's connecting and when
Troubleshooting
Can't Access Web Interface
- Traefik mode: Wait 30-60 seconds after installation for SSL certificate generation
- Standalone mode: Accept the self-signed certificate warning
- Check container: Run
docker ps | grep warpgateto see if it's running - Check logs: Run
docker logs warpgateto see error messages
Can't Connect via SSH
- Check firewall: Make sure port 2222 is open:
sudo ufw status | grep 2222 - Check credentials: Verify you're using the correct Warpgate username and password
- Check target: Make sure the target server is configured correctly
- Check access: Verify the user has access to the target
Forgot Admin Password
- You'll need to reinstall Warpgate with
--deleteallflag - This will wipe all data and let you create a new admin account
- Make sure to back up any important data first!
Target Connection Fails
- Check target host: Verify the host IP/name is correct
- Check target port: Verify the SSH port is correct (usually 22)
- Check target credentials: Verify the username is correct
- Test direct connection: Try connecting directly to the target to verify it's accessible
Where to Find Warpgate After Install
- On the finish screen, Infinity Tools prints the web interface URL
- You can also see it in 📊 STATUS & HEALTH → STATUS
- Check the installation directory:
/opt/speedbits/warpgate - Configuration file:
/opt/speedbits/warpgate/data/warpgate.yaml - Database:
/opt/speedbits/warpgate/data/db/
Managing Warpgate
Adding More Users
Simply repeat Step 8 for each user you want to add. Each user can have access to different targets.
Adding More Targets
Add more servers by repeating Step 7. Users can then be granted access to these new targets.
Viewing Sessions
The web interface shows active SSH sessions, including who's connected and what they're doing.
Session Recording
Warpgate can record SSH sessions for security auditing. Check the settings in the web interface to enable this.
You're Ready!
Warpgate is now installed and ready to use! Remember:
- 🔐 Save your admin credentials securely
- 🚪 Connect via port 2222 (not port 22)
- 👥 Add users and grant them access to targets
- 🛡️ Close port 22 after testing (optional but recommended)
- 📊 Monitor sessions in the web interface
- 🔒 Use strong passwords for all accounts
Next steps: Add your first target, create users, grant access, test SSH connection through Warpgate, and optionally close direct SSH access (port 22) for better security!